Introduction
1.1 History of open cities and the open data for Resilience Initiative
The World Bank, through its Global Facility for Disaster Reduction and Recovery (GFDRR), launched the Open Cities Project in November 2012 to create open data ecosystems that will facilitate innovative, data-driven urban planning and disaster risk management in South Asian cities. Open Cities is one component of a broader World Bank and GFDRR program, the Open Data for Resilience Initiative (OpenDRI), further described in box 1.1.
Open Cities is part of the Open Data for Resilience Initiative, sponsored by the World Bank and GFDRR. OpenDRI brings the philosophies and practices of the open data movement to bear on the challenges of building resilience to natural hazards and the impacts of climate change. In partner- ship with governments, international organizations, and civil society groups, this initiative develops open systems for creating, sharing, and using disaster risk and climate change information to ensure that a wide range of actors can participate in meeting these challenges. Since its launch in 2011, OpenDRI has worked to implement these ideas in over 25 countries around the world.
Since its inception, Open Cities has brought together stakeholders from government, donor agencies, the private sector, universities, and civil society groups to create usable information through community mapping techniques, to build applications and tools that inform decision making, and to develop the networks of trust and social capital necessary for these efforts to become sustainable. This process has been evolutionary, with opportunities for experimentation, learning, failure, and adaptation incorporated into the project planning. This guide discusses the rationale and design of the Open Cities Project, the major components of its implementa- tion to date, and some of the most salient lessons learned from the project so far.
The Open Cities Project launched its efforts in three cities: Batticaloa, Sri Lanka; Dhaka, Bangladesh; and Kathmandu, Nepal. These cities were chosen for
- Their high levels of disaster risk;
- The presence of World Bank-lending activities related to urban planning and disaster management that would benefit from access to better data; and
- The willingness of government counterparts to partic- ipate in and help guide the interventions.
In each of these projects, Open Cities has supported the creation of new data while also attending to the cities’ broader ecosystems of open data production and use. To view the city-specific project data collected thus far, visit the Open Cities website (box 1.2).
The Open Cities website provides case studies and visualizations of, and access to, much of the data collected during the first round of Open Cities projects. It was designed and built by our partners at Development Seed and can be accessed at opencitiesproject.org. It will be updated continually as the program expands and more data become available.
Leveraging robust, accurate data to improve urban planning and disaster risk management decisions requires not only high-quality information but also the requisite tools, skills, and willingness to commit to a data-driven decision-making process. With this in mind, Open Cities also has developed partnerships across government ministries, donor agencies, universities, private sector technology groups, and civil society organizations to ensure broad acceptance of the data produced, facilitate data use, and align investments across projects and sectors.
1.2 Rationale for the Open Cities Project
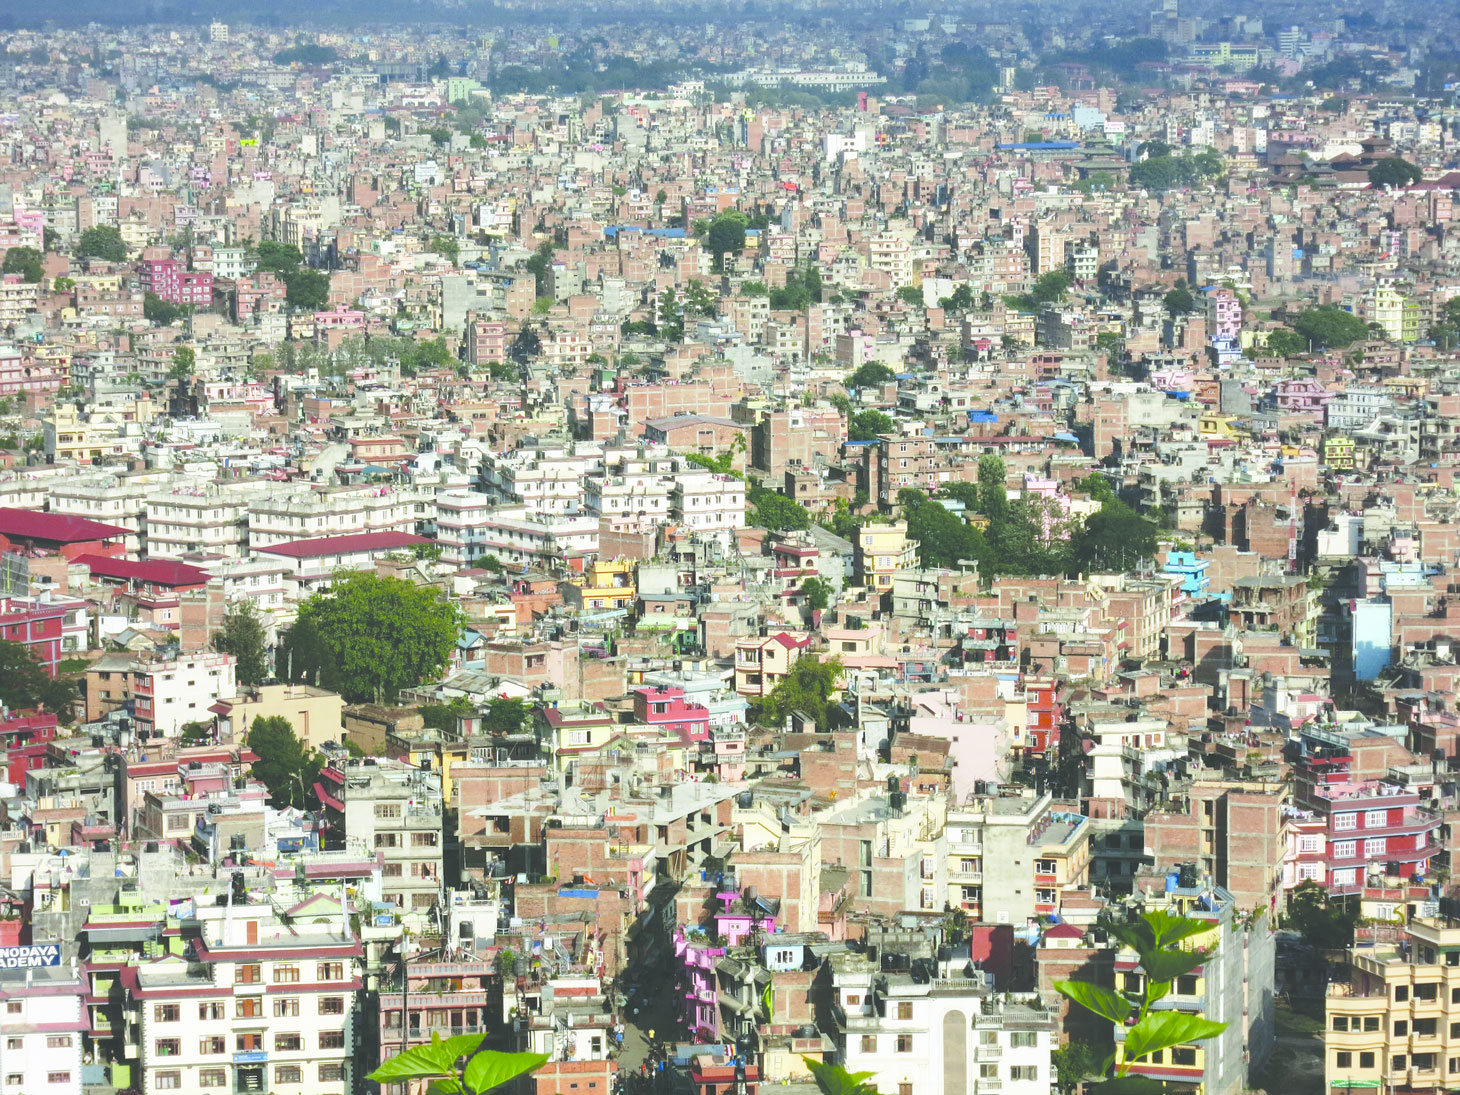
South Asia is one of the most rapidly urbanizing regions in the world. A deep understanding of the built environ- ment is critical to providing relevant services, managing urban growth, and visualizing disaster risk in this context. For example, good characterization of the built environment allows urban planners, engineers, and policy makers to plan for and design appropriate trans- portation systems and adequate water supply systems; to estimate the population distribution of cities; attempt to manage urban sprawl; and to identify potential sites for parks and public services. In addition, growing popu- lations, unplanned settlements, and unsafe building practices all increase disaster risk.
As urban populations and vulnerability grow, manag- ing urban growth in a way that fosters cities’ resilience to natural hazards and the impacts of climate change becomes an ever-greater challenge that requires detailed, up-to-date geographic data of the built environment.
To meet this challenge requires innovative, affordable, precise, open, and dynamic data collection and mapping processes that support management of urban growth and disaster risk. In response to the 2010 earthquake in Haiti, OpenStreetMap pioneered such efforts, as box 1.3 further describes.
Open Cities drew from, and was inspired by, a number of projects involving community mapping, primarily the OpenStreetMap (OSM) response to the 2010 Haiti earthquake and the “Community Mapping for Exposure” effort by Australian and Indonesian governments with the Humanitarian OpenStreetMap Team (HOT). Open Cities and the other projects used the OSM platform to harness the power of crowd and community to create accurate, up-to-date spatial data about locations and characteristics of the built and natural environments. Dubbed “the Wikipedia of maps” by its founder, British technology entrepreneur Steve Coast, OSM is an online database and a global com- munity of over 1 million contributors who collaborate toward building a free and open map of the world to which anyone can contribute and which anyone can use in their own tools and analysis.
OSM was first used in disaster response in a large-scale fashion in Haiti, following the January 12, 2010, earthquake. In the days following the disaster, the World Bank, Google, and several other entities made high-resolution imagery of the affected area available to the public. Over 600 individuals from the global OSM community began digitizing the imagery and tracing roads, building footprints, and other infrastructure, creating what quickly became the most detailed map of Port au Prince in existence. OSM’s map became the de facto map for the area, and it was used on the global positioning system (GPS) devices of search and rescue teams, to help route supplies around the congested and devastated capital, and to coordinate many other aspects of the response and reconstruction effort. Subsequent work supported by the World Bank, the International Organi- zation for Migration (IOM), USAID, and others would go on to help develop an OSM community in Haiti, ensuring local contributors would continue to shepherd and maintain the resource that international volunteers had created.
The experience of OSM Haiti demonstrated that volunteers who collaborated around open data could quickly create accurate and trusted information. Meanwhile, an OSM project in Indonesia called “Community Mapping for Exposure” has sought to create data—locally and in advance of a disaster—that could inform disaster preparedness and contingency planning activities. Working with local governments, university students, and civil society groups, the mapping work has focused especially on critical infrastructure in the capital region of Jakarta, including schools, hospitals, community centers, and places of worship. The resulting data have been combined with hazard information from a variety of sources to produce realistic impact scenarios using the InaSAFE tool. InaSAFE is an open-source project developed by the Australian Government, the Government of Indonesia, and the World Bank that was created specifically for this work but is now being deployed in other DRM projects. The OSM project has since expanded beyond Jakarta and has mapped over 1 million buildings across Indonesia since March 2011.
Open Cities approaches risk assessment differently from catastrophic-risk-modeling firms, whose data are typically used either for broad awareness raising or for the insurance industry. These professional assess- ments often involve computationally intensive mod- eling analysis, but they also tend to rely on statistical representations, proxies, or estimations of the exposed assets, which are expressed in monetary terms. Such data are insufficient for driving specific investments to reduce disaster risk because they typically do not locate, describe, and value individual assets.
By contrast, Open Cities engages local expertise and stakeholders in identifying all building structures in an area and assigning vulnerability attributes to each through community mapping and crowdsourcing. In this way, a risk assessment that identifies particular at-risk structures can be completed. An assessment this precise can identify structures based on importance and risk level and therefore can guide plans to reduce disas- ter and climate risk through physical investment.
Moreover, Open Cities uses detailed information about roads, building infrastructures, and population to help develop land use plans, contingency plans, evacuation routes, and plans for cash transfers to affected vulner- able households in an informed and effective manner. Open Cities thus provides the platform to support activities through the entire disaster risk management cycle. The concept has proven effective and, in fact, can be less expensive to complete than the exposure and vulnerability analyses by typical risk modelers, thanks to the engagement of local experts and stakeholders. It also helps to ensure ownership of, and trust in, the data by the local stakeholders and community.
As the data collected become openly accessible, they can be reused, complemented, and enhanced for other appli- cations beyond the initial project, especially in sectors such as energy and transportation where detailed, up-to- date geographic data are required to develop investment programs. As such, having dynamic and detailed data that are freely available to and enhanced by all sectors of the government, development institutions, and private business creates economic value far beyond the project that initiates the data collection. (Box 1.4 describes the open license for availability and use of the data in con- junction with the OpenStreetMap platform.)
The information collected and added to the OpenStreetMap platform is distributed with the Open Database License (ODbL). This means that although individual contributors hold the copyright to the data they produce, the collective data of all contributors are available under this open license. The ODbL allows anyone to freely copy, distribute, and adapt OSM data. The only requirement is that OSM be given credit in any adapted works, and if the original data are altered, the result should be made available under the same license.
In addition to the value of the data’s sheer availability, the Open Cities Project’s approach of building the capacity of local communities, local and national gov- ernment, academics, and the private sector creates social and human capital, jobs, support to innovation and new business while ensuring that the overall efforts become sustainable. An integral part of Open Cities as a com- ponent of OpenDRI is the development of an ecosystem of data producers and data users through partnerships, capacity building, innovation, and software develop- ment—aspects to be further described throughout the guide.
Open Cities has achieved several noteworthy outcomes during its first year:
- Comprehensive and accessible databases of the built environment. For instance, Batticaloa now has a detailed structural database of every building, and Kathmandu has a database of all schools and hospitals to use for risk assessment.
- Improved in-country capacity to update, maintain, and use key datasets. For instance, Kathmandu has created innovation spaces such as the Kathmandu Living Labs, internship opportunities, and university curricula that provide students with employable skills.
- Mainstreamed open-data use and strengthened data collection and management processes at different levels of government. For instance, the Sri Lanka Survey Department asked for support to start incor- porating crowdsourcing and community mapping approaches into its regular workflow, and the Govern- ment of Sri Lanka sought support for the creation of an Open and Spatial Data Infrastructure.
- Adoption of new applications by multiple levels of government and Bank-financed projects. For instance, forthcoming risk assessments will be driven by detailed data to design physical mitigation investment programs.
- Complementary new partnerships and increased collaboration. New partners to implement projects include the U.S. Department of State, the United States Agency for International Development (USAID), the Humanitarian OpenStreetMap Team (HOT), and the American Red Cross.
1.3 How to Use this Guide
This guide offers a comprehensive understanding of the design and implementation of an Open Cities mapping project—for both practitioners in the field and those interested in a higher-level understanding of the process. The guide’s content is based on experience in imple- menting the initial Open Cities projects in Bangladesh, Nepal, and Sri Lanka as well as on previous mapping project experience. Where relevant, it provides relevant examples from those projects in the text and full case studies at the end of guide.
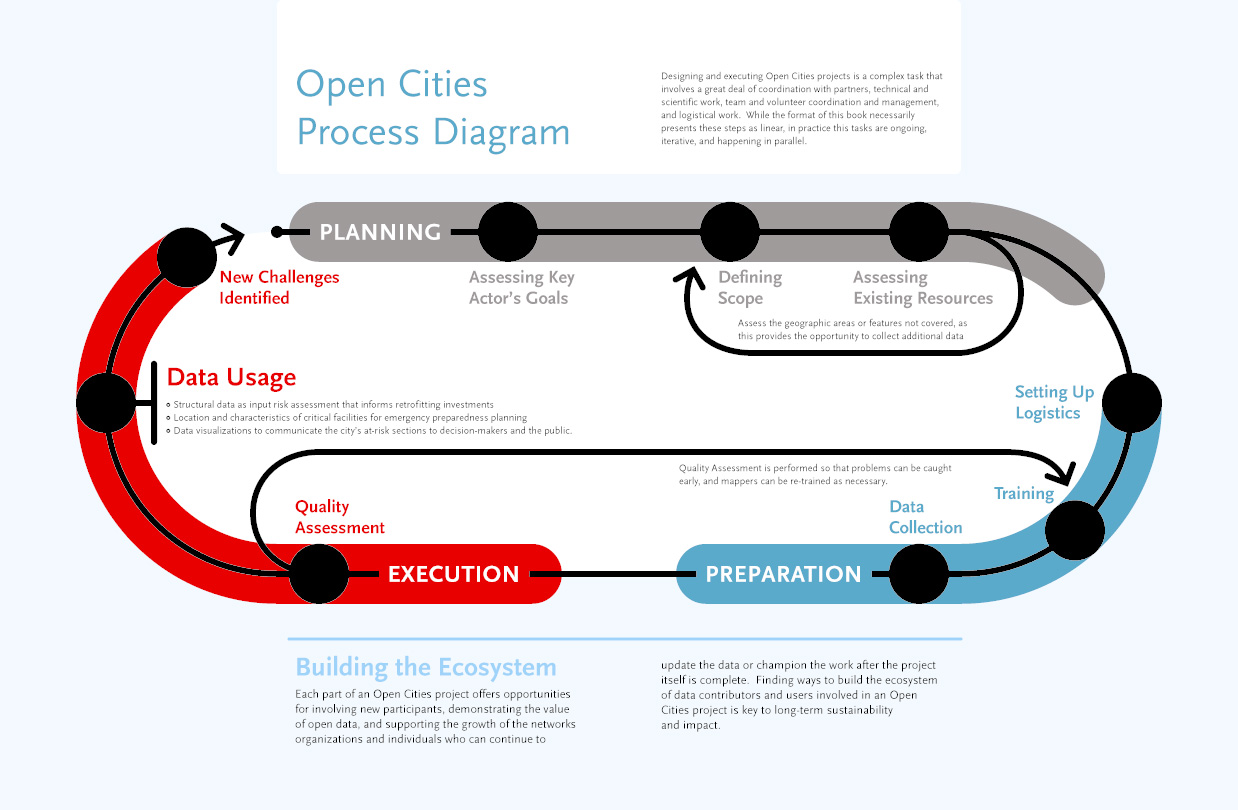
Figure 1.1 depicts the overall process that the chapters will discuss in detail. The next chapter, “Project Design and Preparation,” covers how a project design process begins: by identifying partners, clarifying a project’s objectives and scope, assembling a team of managers and mappers, and assessing the necessary resources for mapping. Chapter 3, “Getting Started,” then describes the steps after the initial planning stage: how to locate an appropriate workspace, assess equipment costs, and prepare staff training. Chapter 4, “Implementation and Supervision,” takes a practical look at data collection techniques from both the organizational and technical perspectives. It also addresses common challenges and mechanisms for quality control and reporting. Finally, chapter 5 examines the lessons learned from previous Open Cities projects and considers future improvements to the overall project design.
Project design and preparation
2.1 Key Partnerships
Involvement of a wide community of partners is a central component of an Open Cities mapping project. The OSM community is already built around the idea of collaboration, and its mapping software serves this purpose. Open Cities project data are sourced from and collected by many users and partners and are open and freely available to anyone who wants to use the data. Thus, engaging a community of users and contributors is an important rst objective of planning a mapping project.
Consider that a good partner
- Is already undertaking work in a similar context;
- Needs the data being collected in its operation;
- Has a passion for change and an openness to innovation;
- Will benefit from the innovation to improve its workf low;
- Provides contextual knowledge; and
- Shares resources such as workspace, relationships,staff, and supplies.
2.1.1 Why Would Groups Join an Open Cities Project?
All organizations involved in disaster risk management and urban planning (such as local and national governments, international partners, and nongovernmental organizations [NGOs]) need up-to-date, detailed data for their operations. Some of them may already be strug- gling to maintain their own datasets. By joining with many partners, organizations nd it easier to keep data relevant and up-to-date and to avoid reinventing the wheel. The data become more useful and more widely used, their application leading to greater innovation,which in turn encourages further collection of valuable data, which feed back into a robust open data ecosystem.
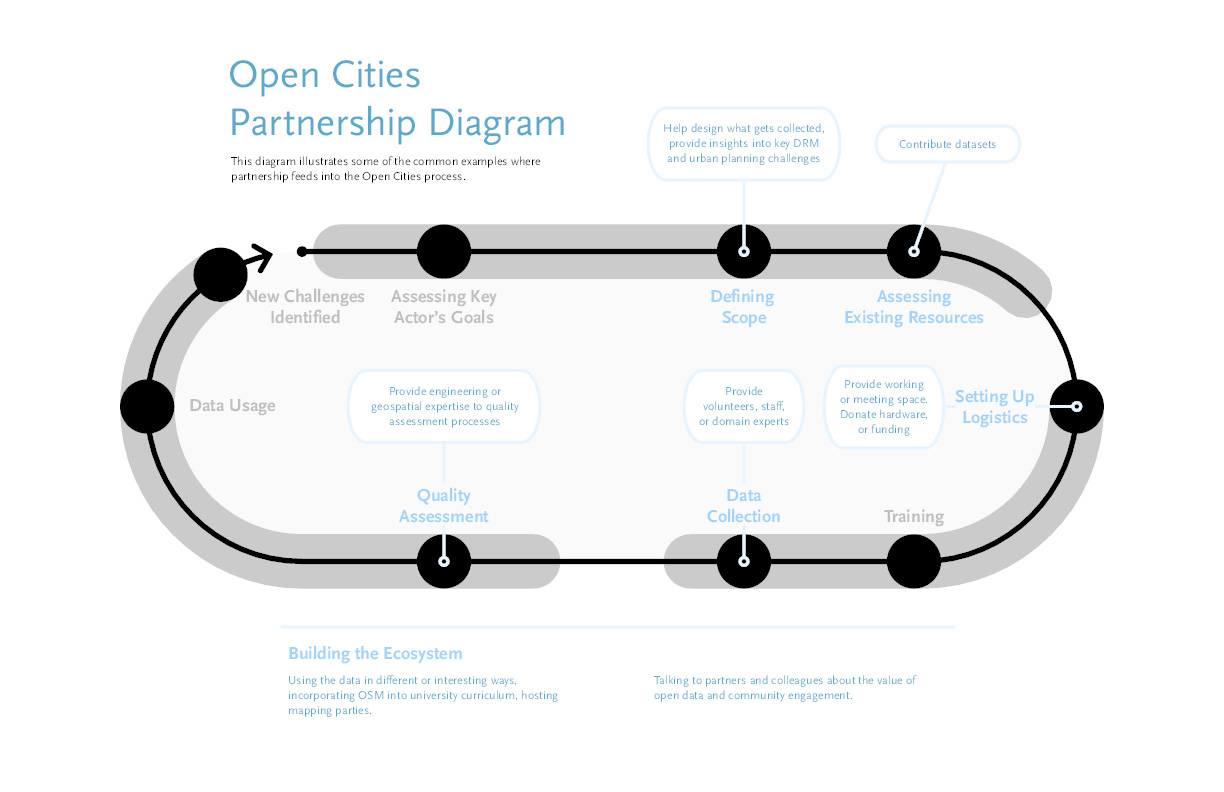
Figure 2.1: Open Cities Partnership Diagram
2.1.2 Outreach
Government support and participation in an Open Cities mapping project is a key strategy for ensuring its sustainability. The OSM community is also a essential resource, along with other partners such as universities, civil society organizations, and the private sector. This subsection examines these likely partners and their potential roles.
2.1.2.1 Government
In most contexts, governmental support will bene t a mapping initiative because different government units can provide resources and ensure better sustainability and legitimacy of the work. Therefore, they should be included as partners from the early stages of planning.
Government entities will bene t from access to up-to-date, detailed data that they already devote great resources to maintain. In the long-term, government can incorporate the Open Cities data collection methodology into national initiatives by sharing data, experience, and resources. This sort of buy-in will strengthen the project over time. In turn, government support can aid your project in terms of planning, legitimacy, access to exist- ing data, and provision of local resources. Government, particularly the national and local agencies that already work in mapping and geographic data, can provide valu- able insight concerning how to plan mapping activities ef ciently. Their involvement also adds legitimacy. For example, mappers may face challenges from local people when surveying an area. With the engagement of local government or other authorities, mappers may carry ID cards or letters of approval to demonstrate of cial support for the project during data collection in the field.
Finally, useful existing data may be found in govern- ment storage. Although convincing government bodies to release their data freely to the public can be a chal- lenge (or some data may be private or sensitive), much of the data will be more useful if opened for public access. Furthermore, if the information collected during the project can enhance and build upon government data, the government will bene t through the return of updated datasets. Open Cities can also be an entry point for the government to increase its capacities, update employees’ skills, and start integrating innovative tools and methods into its work ow to reduce costs and improve regular operations.
Many different levels and parts of the government can be approached, depending on the focus of the project. When starting a project, identify those agencies that are most important to approach for support. Relevant government departments may cover the following areas:
- Urban development
- Disaster management
- Mapping or surveying
- Census and statistics
- Information and communication technology
- Transportation
- Water and sanitation
- Local government (such as regional and municipal governments, village heads)
2.1.2.2 OpenStreetMap Community
Because Open Cities mapping is built upon the OSM platform, another group to communicate with is the existing OSM community. It is important to understand what the mapping community already looks like and how the Open Cities Project might best support and work with this existing group.
What is the OSM community? Simply put, anyone who actively contributes to OpenStreetMap in a given country or region is part of that community. In active communi- ties, mappers communicate with each other often, plan mapping events, and collaborate on OSM development. In quieter communities, mappers communicate less but contribute for their own personal reasons. Active, vibrant communities are the most productive and sustainable, but no matter what the local OSM user base looks like, there are always possibilities to engage.
Even if direct partnership is not developed with existing OSM contributors, it is important to maintain commu- nication with them and inform them of the project goals and target areas. Since Open Cities mapping will likely take place in an area where others have already mapped, the project must not overwrite the information already entered by volunteer mappers who used local knowledge to edit the map. It is critical that the project participants, as a volunteer community, coordinate any large data imports with the existing community and respects work that has already been accurately completed.
There are several ways to get in touch with OSM mappers:
- E-mail lists. In many countries, the mappers commu- nicate through dedicated e-mail lists. You can find such lists at lists.openstreetmap.org
- Facebook. In some places, the OSM communities have chosen to communicate using Facebook groups. Therefore, you should search Facebook to find out whether there is a local group for OSM contributors in the areas you plan to map.
- Wiki pages or sites. It is important to check the status of mapping in certain areas by visiting the OSM Wiki site, starting with the main page at http://wiki.openstreetmap.org/wiki/Main_Page. Most countries have at least one dedicated page to the status of the project.
- The “Neis One!” blog. Another useful starting point for connecting with the OSM community is Pascal Neis’s blog at neis-one.org, which provides tools that show which users are actively mapping in certain areas.
2.1.2.3 Other Groups
Other groups may also be considered potential collab- orators. Table 2.1 describes several sources of potential partners.
Building partnerships is essential to reaching the high- er-level goals of an Open Cities mapping project, such as strengthening the open-source mapping community. Ideally your partners will be directly involved in the planning and implementation of the project. However, if key partners cannot commit time and resources, it is still important to keep them informed about project activities. In this way, you can keep them connected and approach them again later as your project expands.
2.2 Defining the scope of work
The first step of Open Cities project planning is to clearly de ne the objectives. This means answering questions such as these:
- What is the scale of the project? Has this been done here before?
- What will the data be used for?
- What data will we collect?
- What geographic area will we cover?
- What is the time frame for project completion?
| Universities | Universities and colleges are great potential collaborators. Participation in a mapping project offers students and faculty an opportunity to learn about cutting-edge open-source methodologies, ideas, and software. Students are often technically minded, have exible time commitments, and enthusiasm to learn new things. Mapping projects that involve academia may also evolve into a permanent part of the university’s curriculum or even a course by itself. Additionally, Open Cities partners that build university capacity in this way help to develop the quali cations of students who can later be hired as interns or staff. |
| Scientific communities | Local scienti c communities, whether involved in university research or in civil society organizations, can be called upon to support an Open Cities project in several important ways. First, these are important groups to involve in the data modeling process. Civil engineers, planners, and others have experience with relevant data and analysis, so they may be able to provide suggestions as well as important local context. Second, data quality assessment throughout the project, particularly at the end of the data collection period, is critical, and this group may be well placed to support it. |
| Technical communities | Open-source software communities (user groups and private companies) are often closely linked with OSM communities. Freelance software developers, geographic information system (GIS) specialists, and private software companies may be interested in providing software that assists the project as well as services for the community. The technical community also can share its collective professional expertise when hosting a skills workshop, and service providers can rent of ce space or equipment. For example, the widespread Open Source Geospatial Foundation (OSGeo, at osgeo.org) is closely related to OpenStreetMap. |
| Civil society organizations | Civil society projects may use datasets similar to those of the Open Cities project, and potential partnerships should be explored. The synergies that a collaborating NGO can bring to Open Cities include data sharing and collection, youth outreach, and additional connections to the community. |
| International organizations | Many large development projects are funded by international organizations that have signi cant datasets from previous projects. Their interests focus on a variety of areas and potential synergies may exist. Of ces such as the United Nations Of ce for the Coordina- tion of Humanitarian Affairs (OCHA) often have existing mapping capacity and already have knowledge of the local context and existing data. |
| Youth and adult community groups | Community groups, by their nature, attract members of society who are interested in volunteering their time for the bene t of the community. A great example comes from Indonesia, where HOT worked with the Scouts to map thousands of buildings in the Bengawan Solo River Valley. |
2.2.1 Overview of the Process
Defining your project’s scope means considering how much area will be mapped, how much data will be collected, and how much time the project will require—a process illustrated in figure 2.2. These decisions will enable you to determine your personnel and resource requirements as well.
Although your long-term objective might be to map a large area such as a city, district, or even a country, it is advisable to begin with a smaller pilot project (box 2.1) and later scale up. This provides the necessary time and experience to build capacity in your team, nurture partnerships, and gain experience in the process.
The following sections will explain how to de ne the target area and make rough estimates of the number of features to be mapped. We will discuss what a data model is, how it should be de ned, and how to engage partners in this process. Last, we will consider how to manage a project’s time frame and ensure that tasks are properly done in succession, so that your project effec- tively meets its deadlines and its goals.
Pilot projects typically map a small part of a much larger area, over a short time frame. The goals of pilot projects are not only to collect data but also to experiment with the surveying methodology and determine the most effective and efficient ways of mapping. Such projects are also useful for demonstrating the effectiveness of innovative mapping tools and strengthening local support.
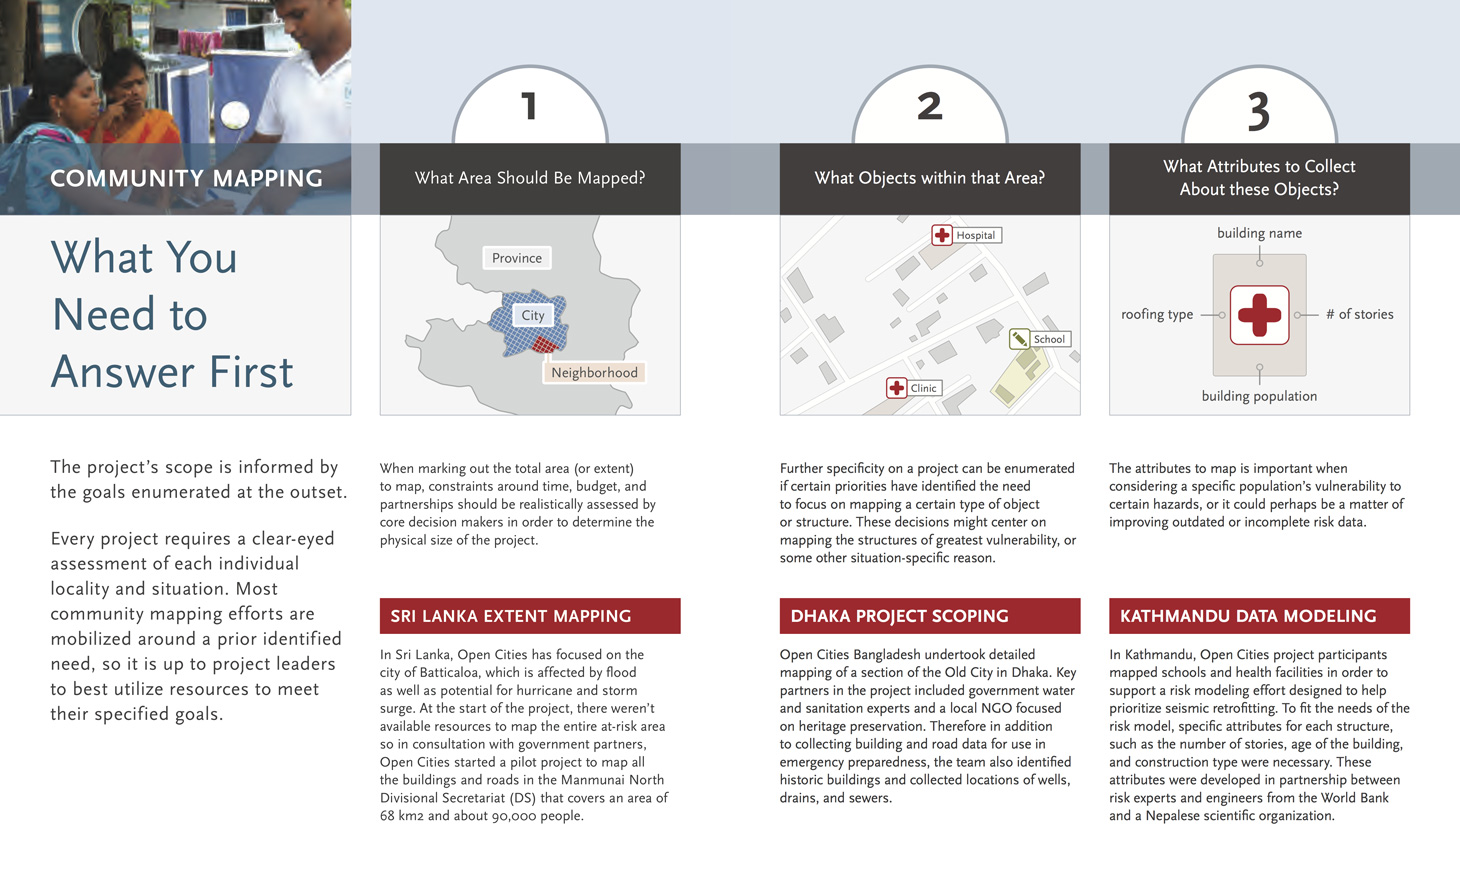
Figure 2.2: What you need to answer first
2.2.2 Why Are You Collecting the Data?
One of the first questions in designing a project is simply, “What will the data be used for?” In other words, why are you collecting data? You should have a good answer for this at the outset because it will define the sort of data that you want to collect.
For example, Open Cities projects are often oriented toward disaster risk reduction. In the case of disaster preparedness, this might mean collecting data about buildings and other critical infrastructure. For starters, the data would include the location of each building and its geometry (the building’s footprint on the ground), but it also includes information about other building attributes such as the number of levels in the building, the shape of the roof, and the materials used for the walls.
To determine which types of features and attributes the project should map, you will want to consult with the partners involved in the project. For example, you may be working closely with the government’s water and sanitation department—and they might not need buildings’ structural characteristics but will be very interested in using data about drainage lines and solid waste.
One potential challenge is that, with numerous partners wanting different information, you may end up with requests to map many different features along with a wide range of attributes for each. Such a large data model may not be practical to map with the resources at your disposal. Increasing the number of attributes collected has, in previous projects, decreased both the quantity of features mapped as well as the quality of the data. It is therefore important to limit the amount of collected information to only the most important features and attributes. Keeping things as simple as possible will help ensure project success, particularly in pilot projects.
Different structural approaches to mapping offer varying advantages. This guide focuses on the most common approach: systematically mapping an area with an Open Cities project team. But the same task can also be completed in other ways, such as by engaging volunteers, hosting mapping parties, or working through local governments.
These alternative methods tend to take longer and be less precise, but their advantages should not be dismissed. Remember that the more individuals and organizations that are involved in your project, the stronger it becomes. The more participants you have, the more users, contributors, and awareness of the data you will have—which, in turn, strengthens the open data ecosystem for the future. We recommend engaging a project team because of the practical goals of a mapping project, but you are encouraged to combine these methods to engage others in the mapping process to realize these additional benefits.
2.2.3 Defining the Target Area
You should precisely determine your intended survey area from the start. Are you mapping an entire city? Part of a city? An arbitrary area?
Let’s say that you are mapping a city. You may simply think, “We are mapping City X. That is the area, and it has been defined.” But what does that mean? Does that mean the official government boundaries of City X? Are we interested in the entire urban area or only the city center? If the target area coincides with an existing administrative division, the area will be easy to define, though it might not follow natural roads and features as well as you might like.
Finally, it will benefit you a great deal to know as much as you can about your target area from the beginning. Think about questions such as these:
- How large is the target area in square kilometers?
- How many people live there?
- How many buildings and roads are in the area?
- What will be the main challenges of mapping this area?
2.2.4 Building the Data Model
A data model is a detailed description of all the data you want to collect in your field survey: the features you want to identify and the attributes of those features you want to collect. To a large extent, the data model will relate to the available time and resources for the project—either determining how much you will need or what the constraints might be due to predetermined limits. To complete this data model, determine how much data you will collect, which methods you will use to collect it, and whether privacy or sensitivity concerns will limit what you collect.
Quantity of data. Defining a data model may be easy or it may take some time. If many partners are involved who want to collect many different types of data, deciding on which data to collect could prove to be a challenge. Remember that you may not want your surveyors to collect 100 or even a couple of dozen attributes about every feature on the ground. The more attributes you must collect, the greater the time and resources you will need for data collection.
Collection methods. You will also need to decide whether surveyors will collect only those attributes that are directly observable, or whether they will be required to speak with building owners. Speaking with building owners will take considerably longer than surveying simply through observation. This decision will greatly affect the surveyors’ mapping speed and therefore the time frame and cost of the project.
Sensitivity of data. Remember also that the data you are collecting will be shared on an open-source database. You will not want to collect data that may be considered private or sensitive.
Figure 2.3 shows part of a sample data model (for a complete sample form, see Appendix 6.1, “Data Design”). It is a good idea to write down the list of features you want to collect and, beneath each feature, to list the attributes you want to collect. For example, one feature you will likely be mapping is roads. Defining the data model for roads means determining which attributes you want to collect, such as the following:
- Type of road
- Name of road (in one or multiple languages)
- Surface types of road (asphalt, concrete, brick, stones, gravel, or unpaved)
- Direction of traffic (one-way, two-way, or variable by time of day)
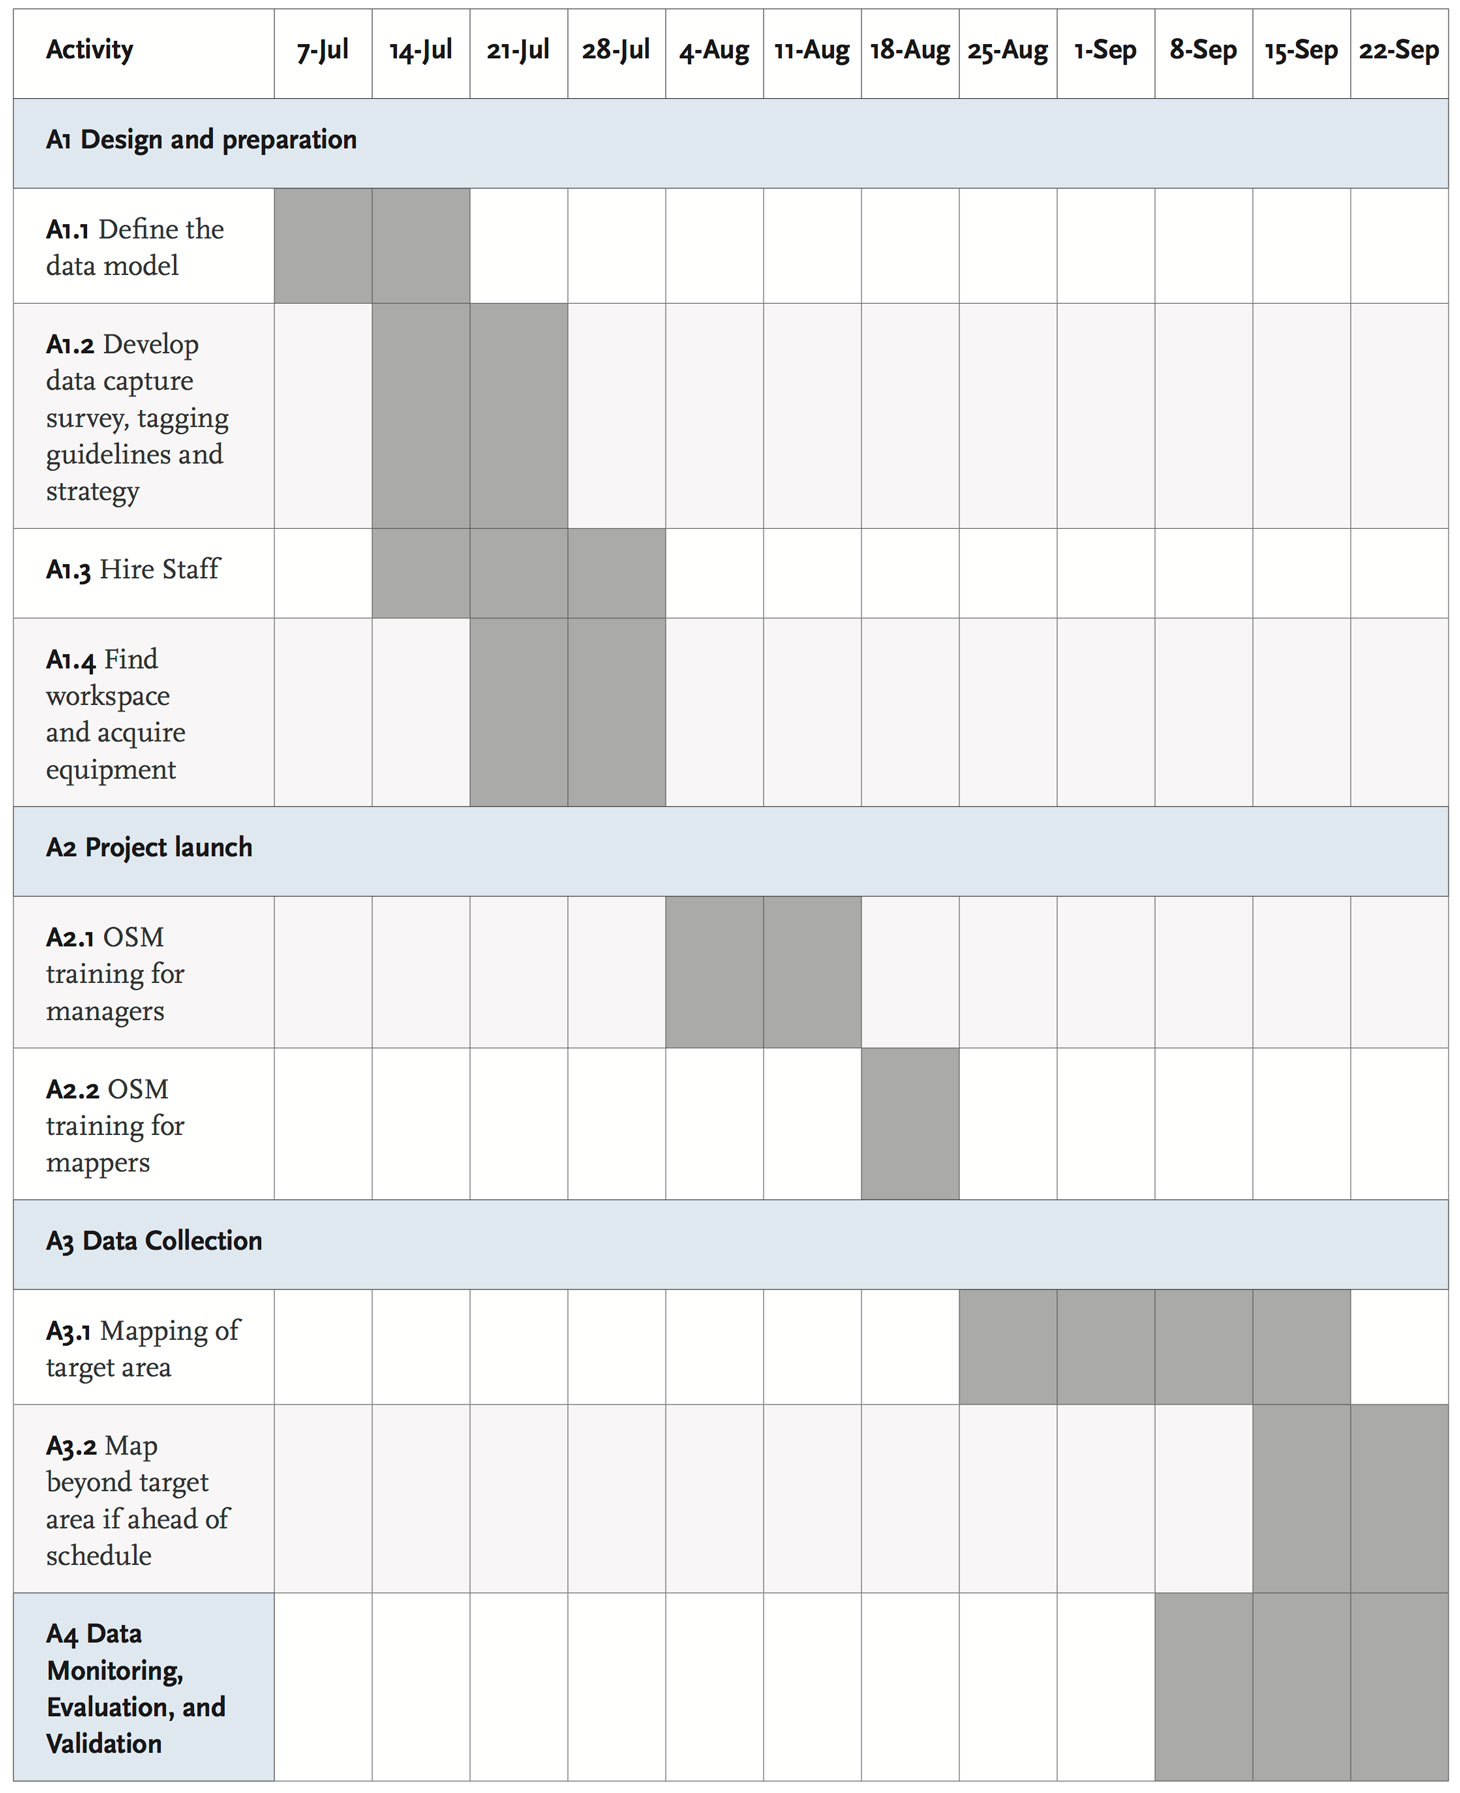
2.2.5 Estimating a Time Frame
Project duration may not be something you can define from the start, but you should be able to estimate it. Will it take a month? Four to eight months? A year? This will become clearer as you plan your project and consider the logistics, but you should begin developing an idea of the time required to complete the project.
Be sure to think through the factors that will affect your survey work, and include them when working on your time frame. Will major holidays occur during the proposed time period? How many days each week do you expect your staff to work? How many hours per day will they realistically be able to work? Keep in mind considerations such as regular work breaks, time for prayers, time for classes (if the staff will include students), travel time, and so on. Figure 2.4 illustrates part of a sample project time frame.
During the Open Cities Dhaka pilot project, for example, a single survey team of two could collect data for about 50 buildings per day by mapping for three or four hours. In some locations, it is common to cover 100 or more buildings per day. Use metrics like these to estimate how long it will take to map a certain region. If you can estimate the number of features in an area and the time it will take to map them, you can better understand the likely time frame of your project.
Figure 2.3: Sample Data Model of Features and Attributes
| Proposed Data Model | ||||||||||||||||
|---|---|---|---|---|---|---|---|---|---|---|---|---|---|---|---|---|
| Streets | Name & Address | Width | Surface Type (Bituminous, Pitch, Brick, etc.) | One way / Two way / not defined | ||||||||||||
| Buildings | Footprints | Usage | Number of Stories | Construction Type (categories consistent with CDMP 2007 survey) RCC/Brick/Block/ | ||||||||||||
Figure 2.4: Sample Project Time Frame
2.3 Building The Team (staffing)
While preparing for your project, consider the logistics that will be involved in terms of staff and office work. Remember that half of the job involves surveying the target area, and the other half is editing work on computers. You may have a small project team, or you may have dozens of people or more. Box 2.3 discusses some of these considerations.
Consider whether all of your staff will be editing, or whether you will divide the tasks of surveyor and editor. It is generally beneficial for mappers to do both surveying and editing, rather than splitting the work, because mappers remember what they have surveyed; even with detailed notes, nobody will be able to edit the map as well as the person who surveyed the features being mapped. Editing tasks also help to overcome “survey fatigue”—when surveyors tire from spending most of their days walking around to perform a single task (and vice versa for editors staying at the computer all day). That said, logistical considerations may require that these two tasks be split, or that different people are editing in the office at different times.
Open Cities mapping project teams generally include people in the several roles described below.
Surveyor and Editor (Mapper)
Surveyors typically work in pairs. Each pair is responsible for field surveying—usually during half of the day, as it can be quite physically tiring. They may also engage in small tasks such as printing field papers. In most projects, each survey team also edits its own work, but these roles can be split. Each day, the pairs will be tasked with part of the target area to map, and they will spend three to five hours surveying, with the remainder of their time spent editing the data. Some of the experience mappers should dedicate some or all of their time to the quality assurance process.
Manager
A small pilot project may have only a single manager, or there may be multiple team managers, each of whom manages a subset of mappers, and who report to a top-level project manager. Managers are responsible for organizing the project workflow, supervising and aiding mappers, and managing equipment and logistics.
Project Lead
At the top of the management structure is typically a project lead (PL). The PL may be the same person as the project manager, or the two roles may be separated. Ideally, the PL will have in-depth local knowledge and relationships with government and academia. The PL, aside from supervising the mapping project, is usually responsible for high-level discussions with partners and community outreach. The PL should be well versed in field data collection and skilled in project management, mapping and GIS, internal and external communications, social networking, and community building and integration.
2.3.1 Management Structure, Roles, and Responsibilities
You can organize your staff in various ways. A single manager can supervise a large group of mappers, or you may choose to divide the team into a number of smaller teams that can operate somewhat independently. (Box 2.4 describes some of these roles.) Either way, you will need people to perform the following tasks:
- Field surveying
- Editing
- Printing Field Papers (see 2.4.3)
- Managing equipment
- Organizing workflow
- Procuring office supplies
- Quality assurance
- Technical support
- Outreach, training, and volunteer mobilization
Mappers are responsible for the day-to-day activities of a project. They are the ones going out to different locations each day within the target area, identifying features, and writing down attributes. They also spend time in the project office, editing the data they collect each day and adding those data to OpenStreetMap. Because their skills will grow, the quality and pace of their work will improve over time. Mappers may also perform office tasks, procure supplies, work with volunteers, or train partner organizations.
A good manager should keep the mappers on schedule and help them as needed. Managers will be more experienced in GIS and OpenStreetMap, so that they can effectively advise mappers during the editing process. It is important that managers check for mistakes and errors in the data, especially early in a project, so that they can inform mappers of their mistakes before they are repeated hundreds of times.
Good managers also maintain strong communication with their mappers and should occasionally accompany them during surveys to observe their work and offer advice. Managers are responsible for performing quality assurance surveys, which will be discussed in section 4.3, “Quality Control.”
What is the OSM Community? OpenStreetMap is a collaborative project involving hundreds of thousands of users and contributors, and the “OSM community” comprises those active members who continually participate by adding to or updating the map.
Each country has what might be called its own community, a group of users who communicate, plan activities, and work together to improve the map. And each country’s community is also connected to the larger global OSM user base. Because an Open Cities project uses the OSM platform, it is automatically engaged in this community. Section 2.2.2.2 earlier provided more information about engaging the local OSM community.
Most OpenStreetMap users go out and contribute to the map bit by bit, so they should be consulted before importing their data. The import might overwrite the work of other mappers who have actually conducted field surveys. You must also send an e-mail to imports@openstreetmap.org and let them know what you are planning. Ensuring that they are aware and supportive of the process before any importing takes place can save a lot of time explaining or reverting the changes after the fact.
For a complete description of the steps to be taken for an OSM import, view this OSM Wiki page: http://wiki.openstreetmap.org/wiki/Import/Guidelines.
2.3.2 Finding Mappers and Surveyors
Survey staffs are often sourced from universities and from recent university graduates. The demands of lengthy field activity can be demanding and is suitable for young people who have an interest in fields related to GIS, geography, urban planning, and engineering. However, the surveying and editing process is not difficult; with the right training, anyone can fill the role, even those with limited computer experience. Those with less computer and geography experience may take longer to train but can still fulfill the job requirements. Mappers are also often found through other partners, such as government agencies, youth groups, and high schools.
As you reach out to potential partners, key influencers and casual mappers will be identified who are interested in the project focus and can be added to the team as the project expands. A unique aspect of the Open Cities data collection methodology is the use of crowdsourcing from both the international and local OSM mapping communities. When engaging the local community, it is often students who have the time and interest to contribute to the project. An Open Cities project provides the opportunity for knowledge exchange between academia and the implementing organization. As a result, the surveyors can be sourced from local university students and recent graduates in geography, computer science, or other project-related technical disciplines.
2.3.3 Compensation and Incentives
There are various methods for compensating project members depending on their background and interests. If you assemble a management structure with a team of managers (known as a core project team), they will most likely be paid as full-time staff. Others, such as volunteer students or young professionals, may either be strictly volunteers, incentivized through an internship or academic credit, or offered per diem or even full-time payment.
Because OpenStreetMap is an open data project built around a community of volunteers, a frequent debate concerns whether mappers should be paid during a targeted mapping project. On the one hand, it is preferable to find ways to encourage mapping other than payment in order to foster a sustainable initiative and mapping community. On the other hand, a targeted mapping project may require mappers to dedicate a great deal of their time to complete the work within a given time frame. In the end, the choices about how to compensate or incentivize mappers will depend on the particular demands of the project.
Volunteer mappers can be incentivized by designing the position as an internship opportunity, by working with universities so that they receive academic credit, or by simply offering the reward of community service and skills development. The broader benefits of participation were discussed earlier, in section 2.1.1.
Another approach toward providing incentives is to develop competitions between universities, departments, or parts of the mapping community. Although monetary rewards have been found to lead to a spike in data collection, collection may also dramatically decrease after a competition is over. Therefore, although competitions provide a potentially useful way to gather a lot of data, they are not necessarily a good way to support community growth in the project focus area. In the case of a mapping competition, creative prizes or rewards (such as mapping hardware) can be used as incentives that may not result in temporary, opportunistic mapping.
2.4 Assessing existing map resources
Once you have established the foundation of your project, you must assess the resources that are available for mapping. For example,
- Are there any preexisting data that will be useful and available?
- Is the target area covered by Bing or Mapbox imagery? Are other sources available?
- Do you have GPS units available? Mobile phones? Will you need them?
The purpose of such resources is twofold. First, it is always better to start with some objects already on the map, rather than with an empty canvas. If you already have two streets drawn on the map, you can easily add a school at their intersection. But if you don’t have those streets drawn on the map, you have no landmarks by which you can correctly locate the school, thus requiring much more work. Therefore, it is always best to have an existing base map before going into the field.
Second, these resources aid you while you are mapping. For example, if you are carrying a satellite picture with you while out surveying, you can usually identify objects by comparing what you see to what is shown on the image. This will also help you to understand the correct sizes and shapes of features. Later, the imagery can be used to accurately trace polygonal features into OpenStreetMap.
2.4.1 Existing Digital and Paper Data
Because Open Cities uses the OSM platform, there will almost certainly be preexisting data on the map. The OSM project has been around for nearly a decade, and there are few places in the world without at least a few roads already drawn. This is helpful because it means that Open Cities projects do not start from scratch. It is important to remember, however, that your project mappers should not delete features that others have created. The purpose here is to collaborate and work with other users as well. Once you have defined your project target area, it is a good idea to examine the existing OSM map and assess how detailed it already is. You should also contact any active OSM users in that area to let them know what the project is about and to see whether there are any opportunities for collaboration.
Often, other sources of data will also be available to you. Public government data might exist in either digital or paper format. In Open Cities Sri Lanka, regional paper maps already existed in each district. Surveyors used them as references to make improved, digital maps with OpenStreetMap.
Digital data often exist as well. In the Open Cities Dhaka pilot project, for example, the team received permission to use old government road and building data. They decided it would be easier to use these data as a base layer that could be updated rather than starting from a clean slate, and so the data were first imported into OpenStreetMap.
2.4.1.1 Data Imports
Importing data can save time and work if there are existing data that correspond to your data model and that you are free to use. For example, if you plan to map 5,000 buildings and the city government has footprints for all those buildings, you might consider importing the data into the OpenStreetMap database. Box 2.5 further discusses how to work successfully with the OSM community on data imports.
If it takes 30 seconds to draw the geometry of a building, then it would take approximately 40 hours to draw 5,000 buildings—a week of someone’s time.
Before you think about importing data, you must consider the following:
- Are the data of good quality? How and when were they created? Are they better than, as good as, or worse than data you would collect yourselves?
- Are the data in the public domain, or do you need explicit permission from the agency that created the data?
- Is the net benefit of importing the data greater than the cost of creating it new?
- Who will import the data?
Written permission is generally required from agencies that are willing to donate data to OpenStreetMap, and they must understand that once they offer the data, the data will go into an open-source database that anyone can use. Getting this permission can be easy in some places, but often agencies are rather protective of their data. This is particularly true of governments that are not familiar with the ideas of open data, and it can be a challenge to get their permission and understand the meaning of an open license. For a sample permission letter, see Appendix 6.3.
Importing data is not difficult, but it requires an advanced understanding of OpenStreetMap and can take a significant amount of time, because imported data must be manually merged with existing OSM data. If you do decide that importing data is the right course to take, you must have a clear plan of how to import the data and discuss it beforehand with the OSM community.
A common question during any mapping project is, “Why can we use imagery from Bing but not from Google?” The short answer, and one not always easily understood, is licensing.
Any company or organization that sells or distributes imagery has a license describing what users are allowed to do with it. In most cases, people are forbidden from making derivative products. This means we are not allowed to use imagery to help make maps unless we receive specific permission to do so. Because Google has not given permission for the OSM community to use its imagery—or any other information from Google—as a resource, such use is not allowed, and edits derived from Google are illegal.
On the other hand, Microsoft has given explicit permission for OSM contributors to use its imagery, which is of good quality in many parts of the world. DigitalGlobe, a satellite imagery company, has also released a great deal of imagery through Mapbox. It is always best to check these resources first and to assess the quality of the images in your project’s target area. Available imagery sources can be viewed in the Java OpenStreetMap Editor (JOSM).
2.4.1.2 Other Local Data Sources
Consult the sources described below to find additional existing local data.
Mapping agencies. Most national governments have a department or agency that deals exclusively with mapping. Whether it is called the survey department or something else, it is responsible for managing a country’s geographic data. If the department or agency is willing to provide some of its data as public information, it can be a prime source for acquiring existing data.
Urban development agencies. Some cities or countries have government departments specifically oriented toward urban development. Such agencies may possess a wealth of urban-oriented geodata.
OCHA. The UN’s Office for the Coordination of Humanitarian Affairs has had a local presence in many countries for many years. It typically has plenty of local knowledge and often is more willing than government agencies to make its data available.
NGOs. Typically hundreds if not thousands of NGOs exist in a given locale, and those working in certain fields may have collected data from previous projects. Organizations working in disaster relief, water and sanitation, or urban development are good places to begin asking around.
2.4.2 Availability of Imagery for Digitization
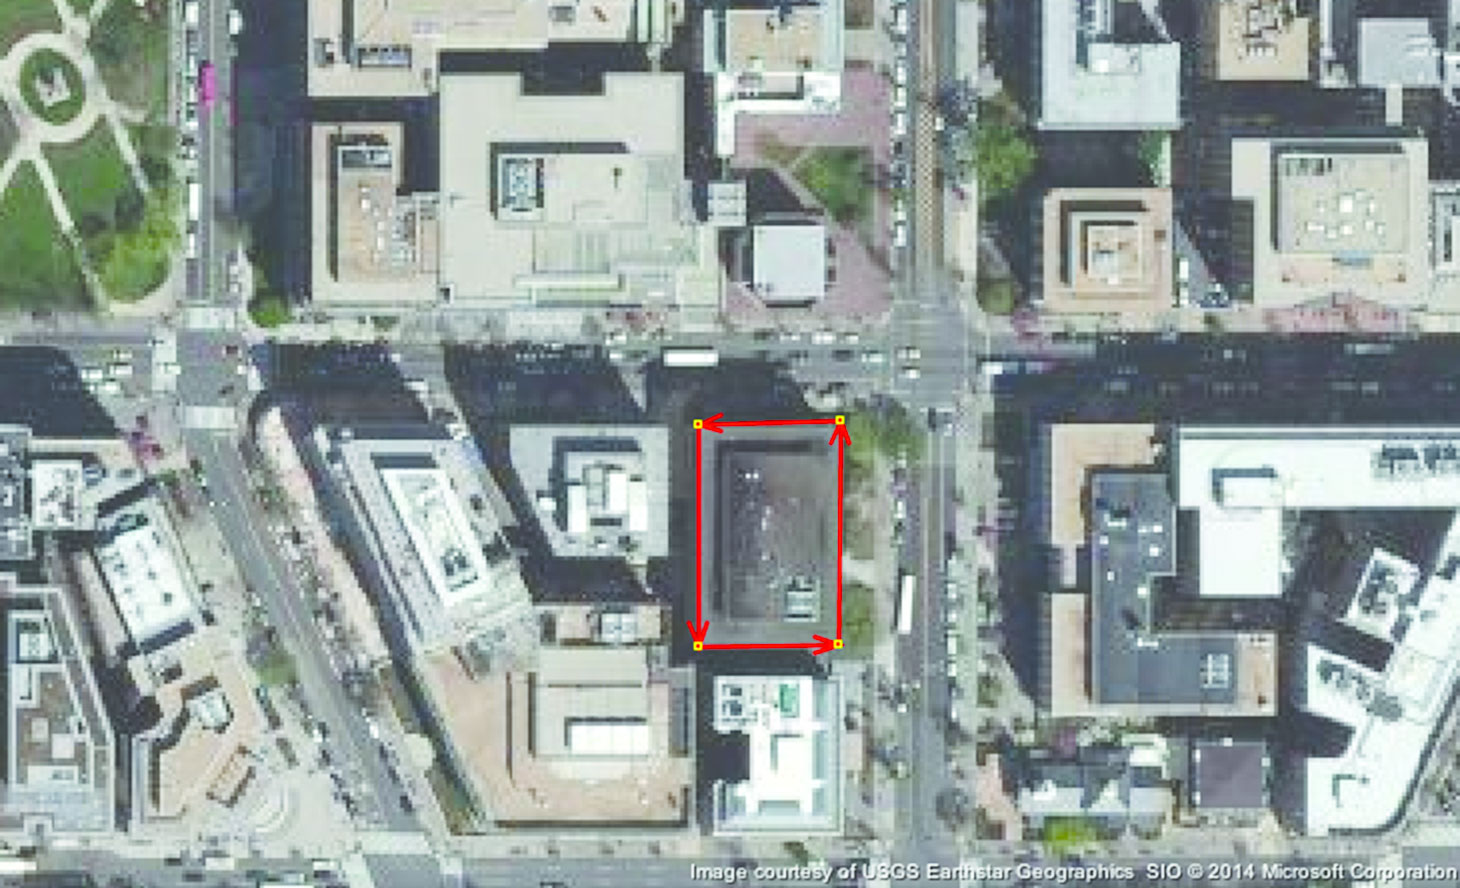
Perhaps the most effective aid in mapping is aerial imagery, as shown in figure 2.5. Aerial images are photographs taken from satellites or airplanes, which are then oriented accurately by their location on Earth.
Aerial images can be viewed as a background in the OpenStreetMap editing software. Mappers can use what they see to trace lines. This can be useful before field surveys, to create a skeleton base map that shows roads, buildings, and anything else that is identifiable solely from the imagery.
Aerial imagery can also be used during field surveys and editing. It can be printed out and carried in the field, helping mappers to orient themselves and identify features on the ground. Later, when they are editing, they can reference the sketches and notes they made in the field with the imagery in the editing software and accurately draw objects on the map.
While preparing for a project, the identification of suitable imagery should be undertaken early. If good quality, high-resolution imagery is available, this will benefit your project tremendously and mean less time and less work. If you cannot find good imagery, however, other methods will be required for digitizing objects on the ground.
Figure 2.5 Use of an Aerial Image to Trace Lines on a Map
2.4.2.1 Assessing Bing and Mapbox Imagery
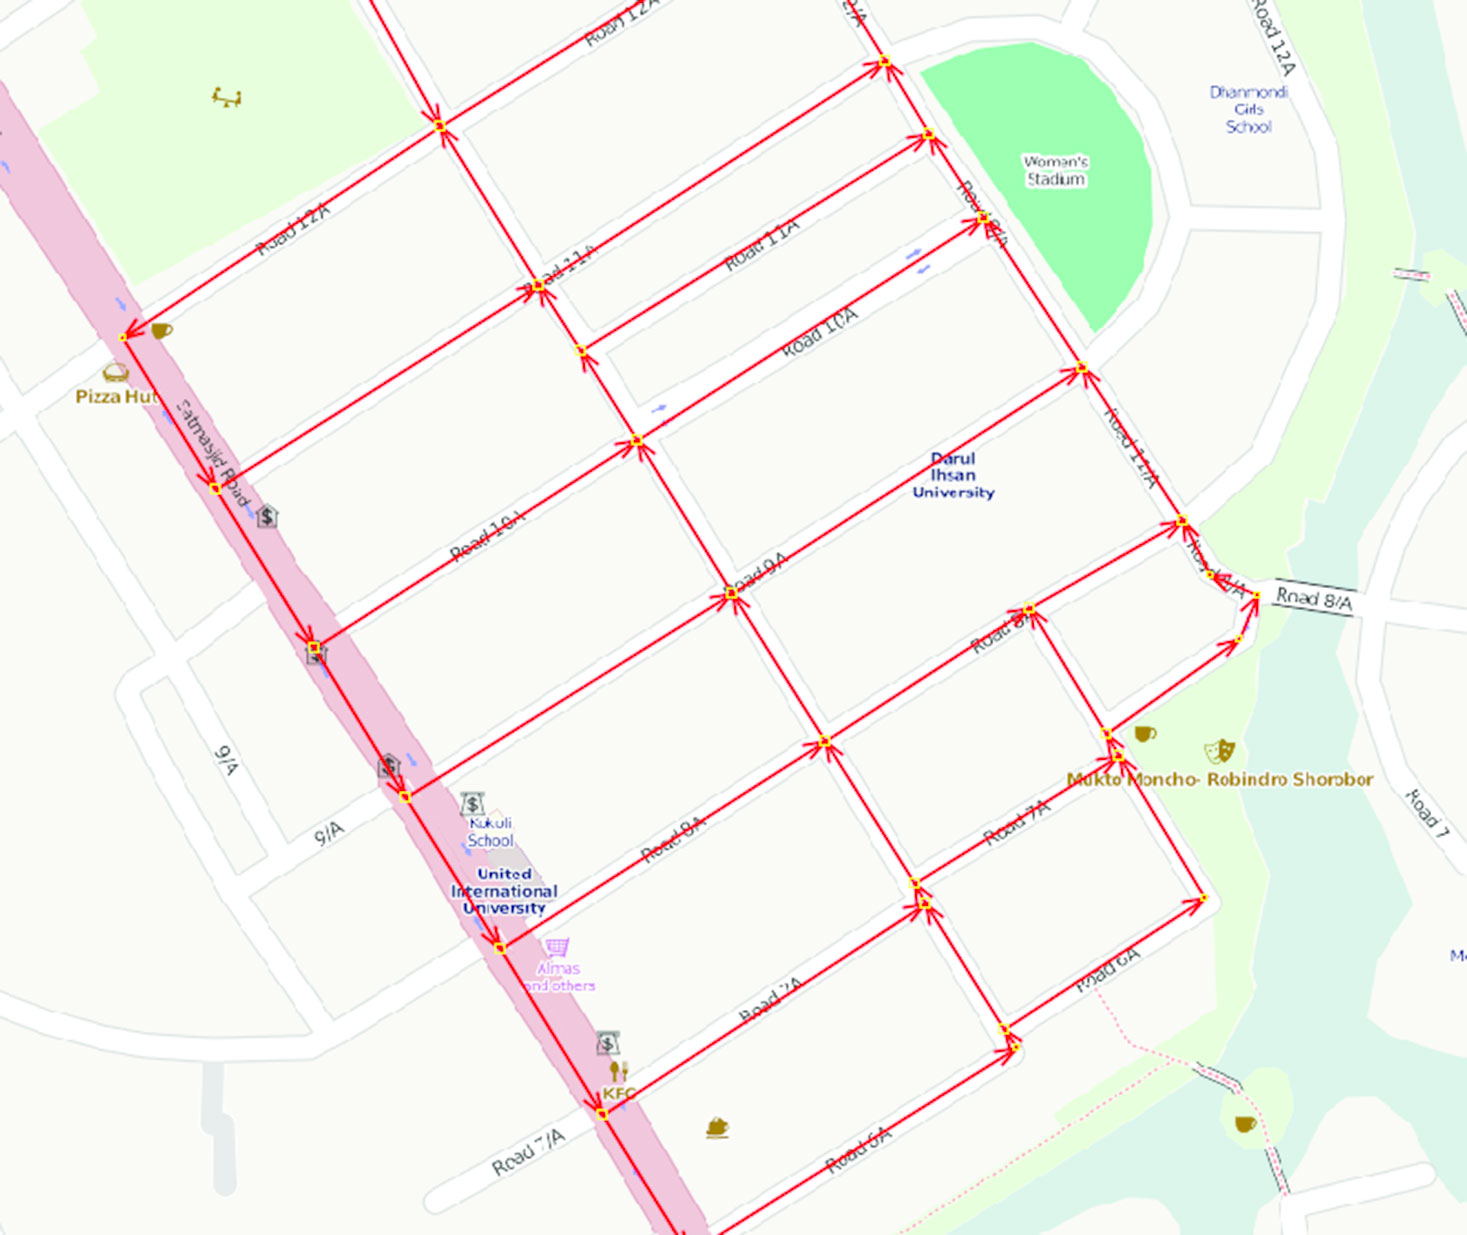
Several imagery sources are available to OSM users, but those with the widest coverage and the highest-quality images are Microsoft’s Bing search engine (figure 2.6) and Mapbox, which provides open-source base maps, design tools, and OSM-powered street data. Box 2.6 discusses the importance of using only those sources that have given permission to use the imagery.
Figure 2.6: Example of a Good Aerial Imagery from Bing
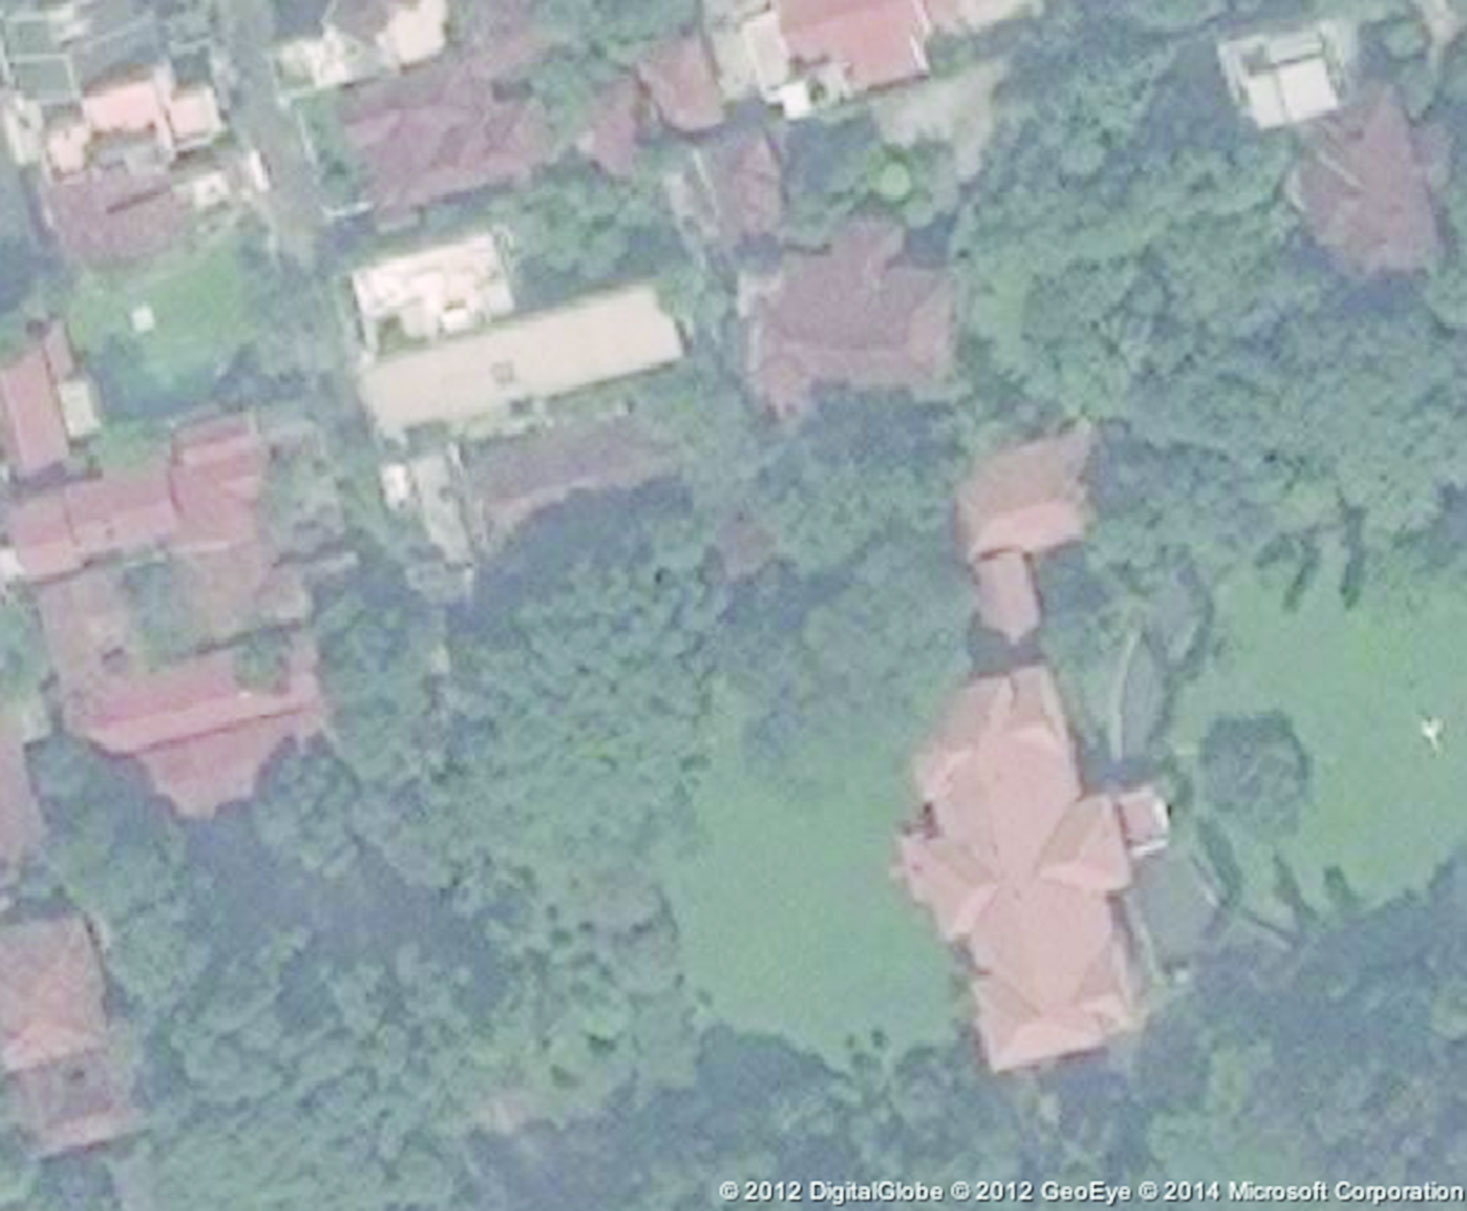
After defining your target area, you should assess to what extent you will be able to use this imagery, assuming that you plan to use it for your survey. If you are lucky, high-resolution imagery will cover your entire target area. Usually, however, parts of your target area will be obscured by clouds (figure 2.7) or not have high-resolution imagery at all.
Figure 2.7: Cloudy Aerial Imagery

During the planning stage, consider using GIS software to draw lines around the parts of your target area where Bing imagery will be suitable for mapping as well as those areas for which usable imagery is unavailable. This will help you understand what proportion of the target area will require another imagery source or a different methodology.
During the project’s design and preparation phase, the following tasks should be completed:
Partner Outreach
- Identify relevant partners in government, academia, and civil society
- Meet with potential partners, discussing support and areas of collaboration
- Communicate project goals with OpenStreetMap community and meet with local mappers
Defining the Scope of Work
- Obtain a map containing the boundary of the target area
- Estimate the number of features you will map in the area, such as roads, buildings, and so on
- Write out your data model
- Map the data model to OpenStreetMap tags
- Establish a rough time frame for survey completion, noting holiday periods that will halt the work
Building the Team
- Establish management structure
- Determine sources of your staff and how staff will be compensated
- Hire staff
Assessing Resources
- List the existing digital and paper data
- Determine whether you will import any data; if so, create an action plan and time frame
- Draw a map showing parts of your target area where no imagery is available
- Determine whether you will use GPS devices, smartphones, or both; if so, acquire
- Confirm that the necessary base-map data are available to use in Field Papers
2.4.2.2 Alternative Imagery Sources
Finding alternative imagery sources is a lot like finding possible data you can import. There is usually some imagery floating around, but it is often of questionable age and usefulness, and of even more questionable legal right to use.
Typically satellite images that have been purchased from a major provider like DigitalGlobe are not licensed for use in mapping in OpenStreetMap unless specifically designated as such, and any company or agency that has these data does not have the right to reuse the data for this purpose. However, imagery created directly by governments and companies may be usable. If someone is willing to donate imagery, the license should be investigated at the start.
Imagery can be purchased from companies such as DigitalGlobe and GeoEye, but this can quickly become expensive. The cost per square kilometer is around $15. It is usually best to find freely available sources of imagery, which are also more sustainable in the long run.
In some cases, imagery is made available through the U.S. Department of State’s Imagery to the Crowd initiative. This is typically provided in the aftermath of disasters to aid remote mappers. Learn more about Imagery to the Crowd at mapgive.state.gov. Remember, too, that using aerial imagery as a background layer is generally considered to be the easiest way to map, particularly when many buildings need to be digitized.
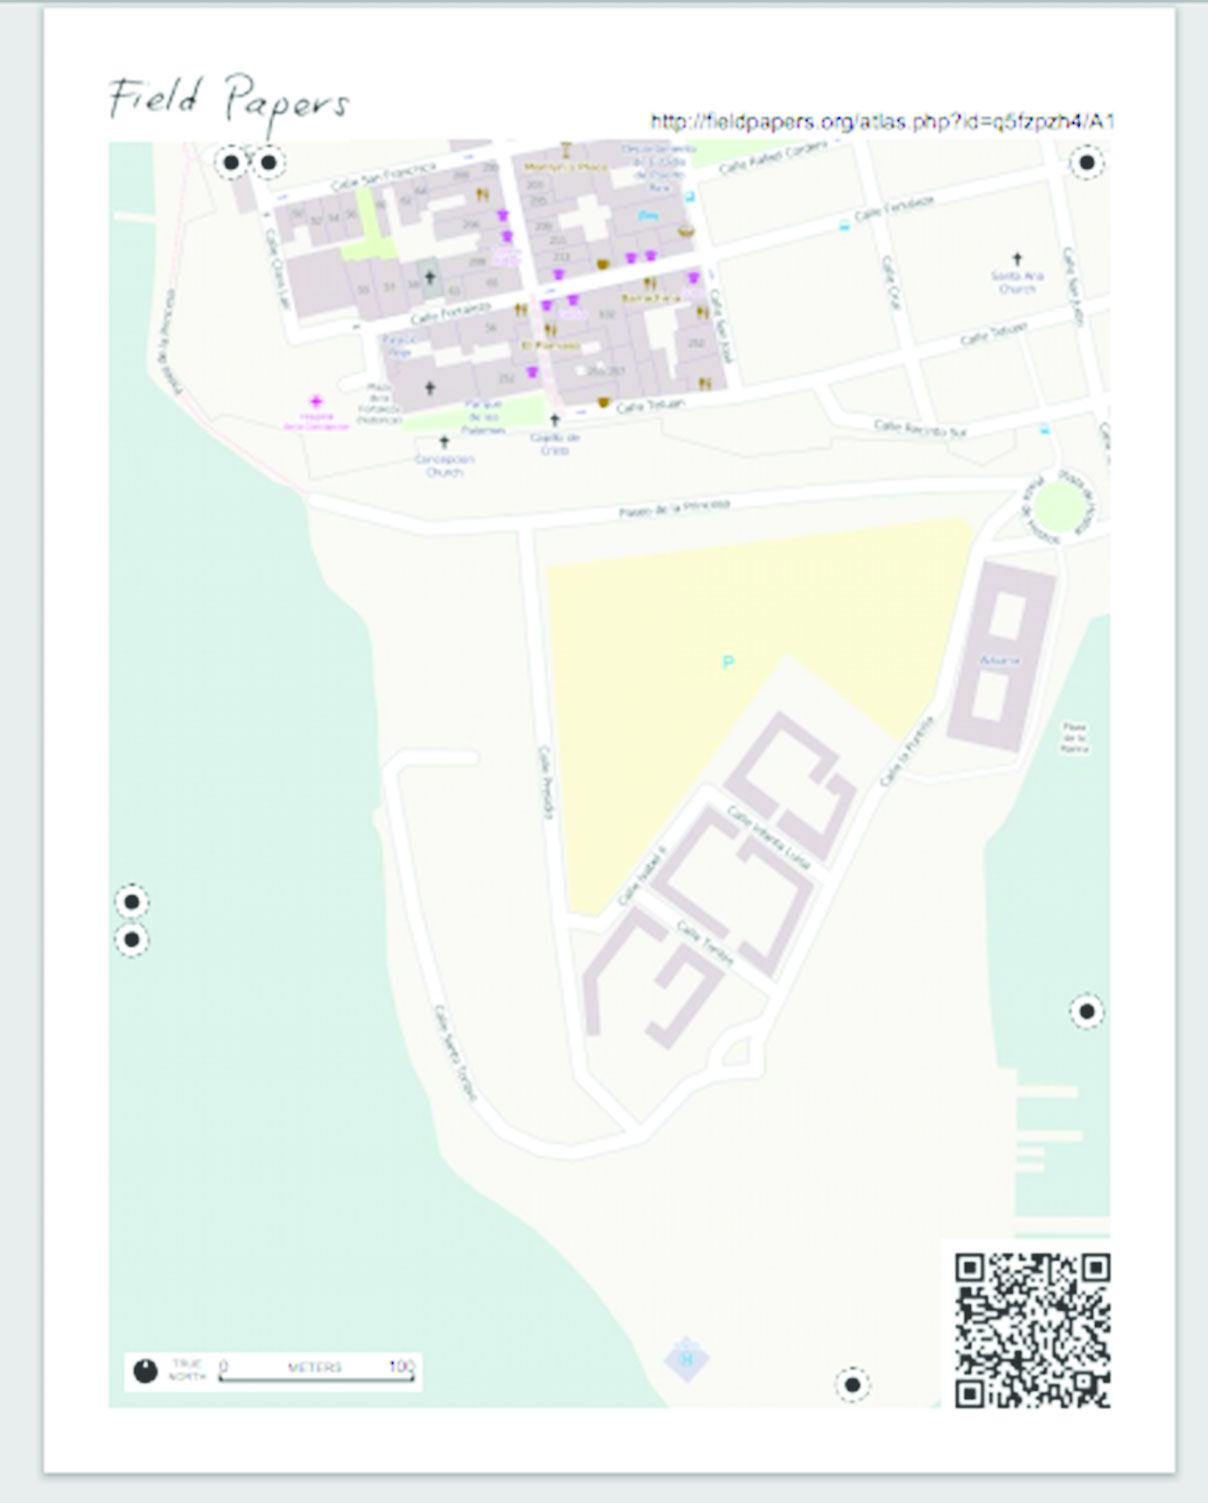
Figure 2.8: A Field Papers Atlas Map, without Imagery, Used in Sumba Barat, Indonesia
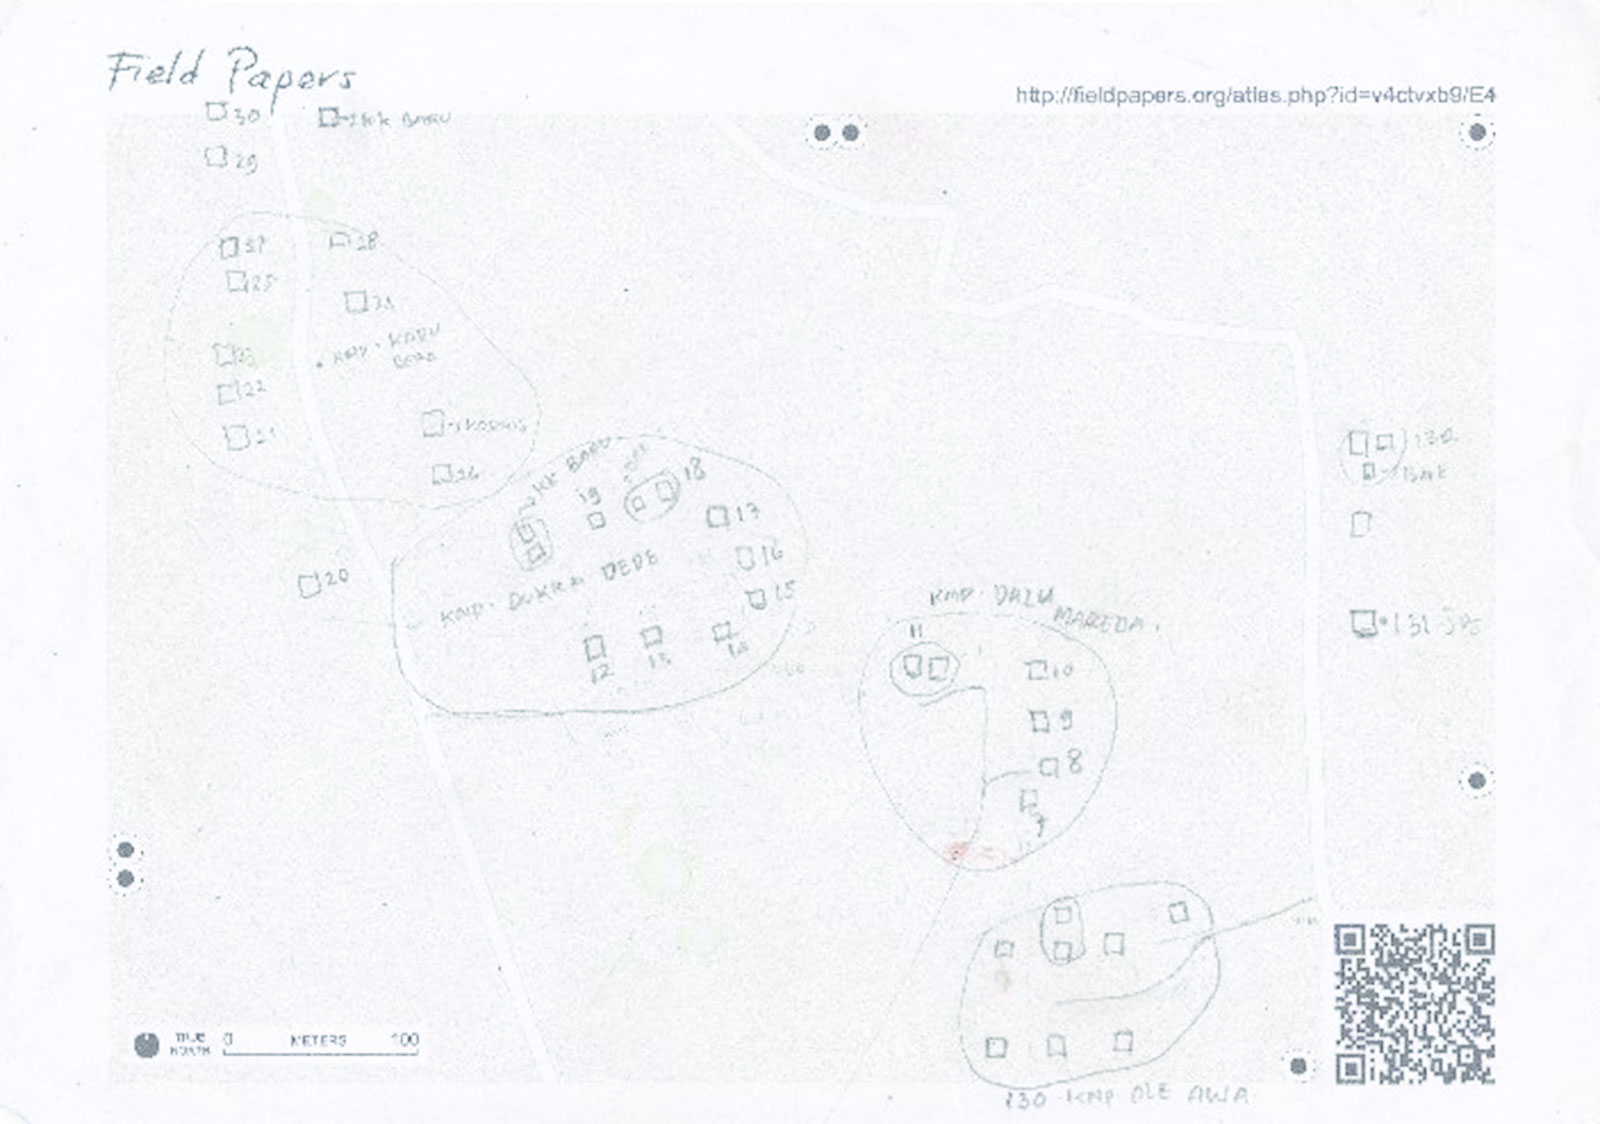
Figure 2.9: A Field Paper Atlas Map Example
2.4.3 GPS Devices, Field Papers, and Smartphones
If imagery is unavailable for part or all of your target area, having a good base map becomes even more important. If detailed, existing data such as road networks and landmarks are already on the map, you should be able to use this as a reference to add new features in their correct locations. If a good base map is not already available, you will need to use GPS to build up a base map of your area.
GPS devices allow mappers to record paths along which they walk as well as individual locations, which are stored with accurate latitudes and longitudes. These data can be imported into JOSM and then traced to add features to the database. When no imagery is available, it is a good idea to use GPS to build up a base map first. Survey teams can first traverse an area with GPS devices, locating roads and major landmarks. In a second stage, they can use this base map as a reference to go out and collect more detailed data.
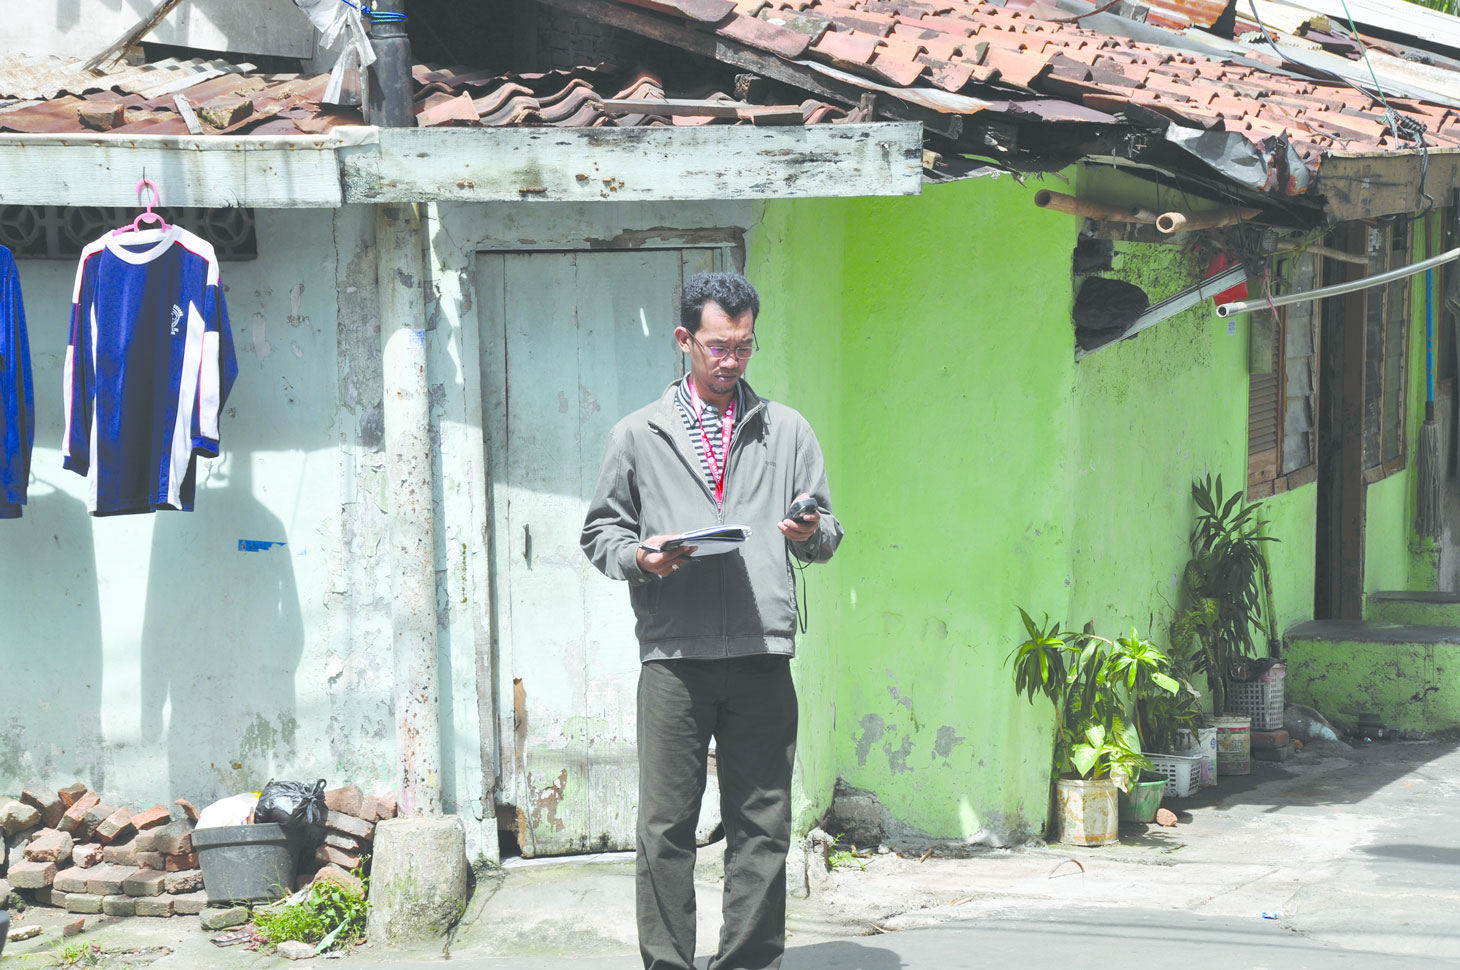
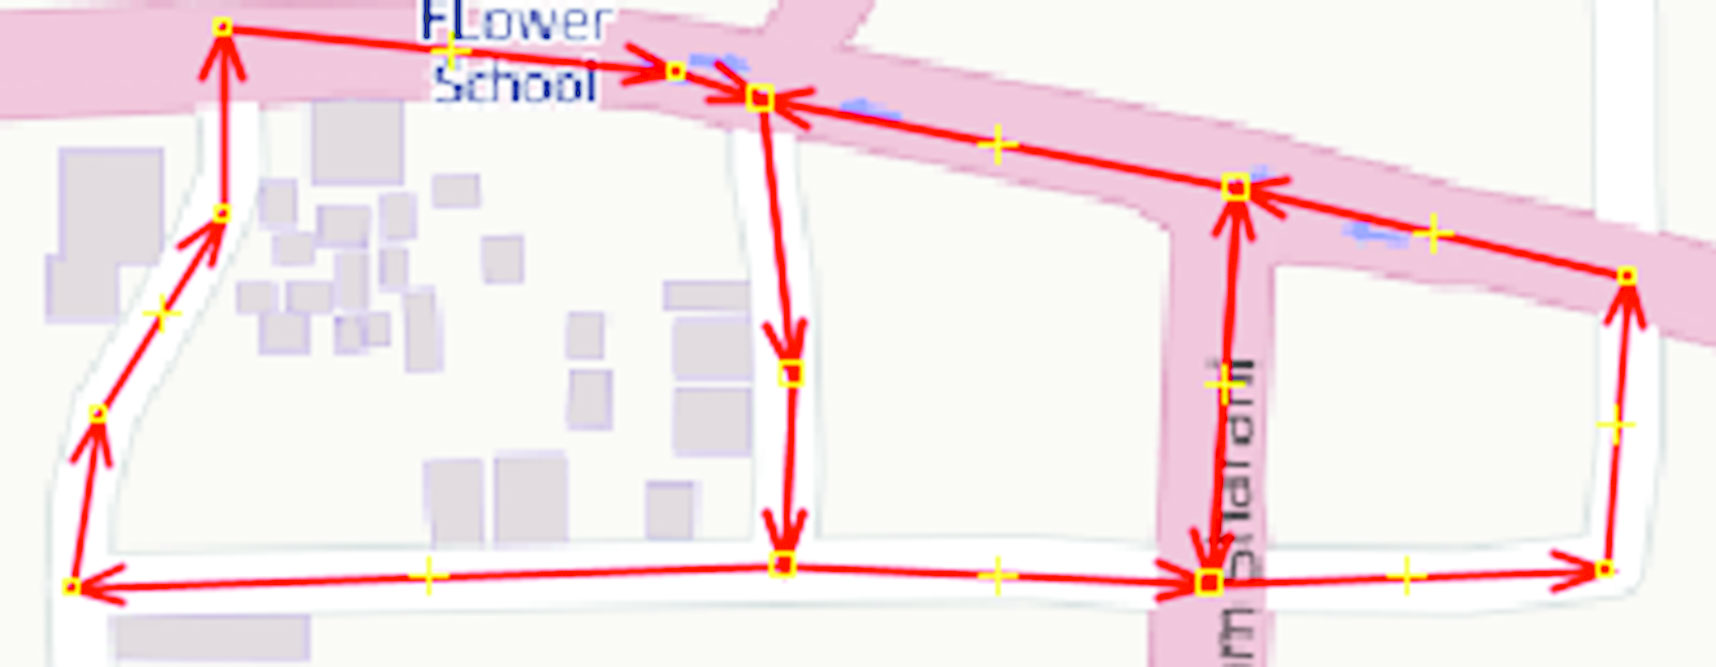
A service for OSM known as Field Papers enables mappers to print out a piece of paper that displays either an existing OSM map, satellite imagery, or a combination of both. The mappers take the Field Papers into the field, draw on them, write notes, and add features to the map—an example of which is shown in figure 2.8. Later, the papers can be scanned back into the computer and automatically geo-referenced to their correct locations on the globe. It is then a simple process of digitizing the hand-drawn notes.
This process can be used for building up the base map, as well as for the daily mapping activities of a project. Each day, mappers will print out Field Papers of small areas, which surveyors can use to sketch buildings and areas using the correctly located roads as a reference.
Figures 2.8 and 2.9 show examples using Field Papers “atlas maps.” Creating rough sketches of building shapes and their locations is not very precise, and often mappers wonder whether this is a problem. Ideally, building shapes will be more accurate, but such accuracy is difficult without imagery to use as a reference. If this mapping methodology is used, it is not a major problem. More important than precise building size and location is the topology—which helps to ensure that the buildings are placed correctly in relation to each other and in relation to the (accurately positioned) roads.
Last, you can use mobile applications to collect OpenStreetMap data. Although applications have been developed to map using mobile devices, none of them provides all of the editing features of desktop software. Mobile applications are best at mapping points of interest. For a list of Android editing applications, see http://wiki.openstreetmap.org/wiki/Android#OpenStreetMap_editing_features.
Getting Started
3.1 Finding a workspace
A major consideration is the location of the project office. If you already have an office, you should consider whether it is in, or close to, the target area. Remember that travel between the editing location and the area being mapped is time-consuming; hence, planning transportation logistics is important. If you can save your mappers some time, the project should take less time and cost less money. It may be worthwhile to organize an office space close to the target area so that the mapping process runs more smoothly.
In any case, care should be taken so that the office used for editing has a minimum of electrical, computer, and Internet problems. Because OpenStreetMap editing works best with a good Internet connection, frequent disconnection is enough to effectively halt the process, wasting valuable time and slowing progress. If your staff comes in for editing and has no Internet access, they have nothing to do and you lose half a day of time. A prolonged outage can be even more costly.
If Internet access is often lost, consider purchasing backup connections such as 3G modems. The additional cost often will outweigh the cost of lost time while waiting for service to return.
Other considerations for your workspace include opportunities for community engagement and collaborative work. While not strictly necessary, it may be beneficial to have a meeting room that can accommodate a dozen people—ideally one that is easily reconfigurable to serve a wide variety of functions. Training could also be conducted here, although if you have many mappers to train, you may need to identify a larger facility for the initial training.
When possible, the office should provide a creative communal space furnished with items such as whiteboards and couches. This will encourage open discussion and facilitate brainstorming to identify current and future challenges, examine alternatives, and develop solutions or alternative actions.
The initial project phases involve engaging the local OSM community and hosting mapping workshops (or mapping parties) to raise awareness of the Open Cities project and identify interested individuals, communities, schools, government departments, and private organizations. Mapping parties can be organized either at the project office or at other venues in the focus area such as university labs, private or public offices, community centers, and libraries. Of course, the budget should take into consideration the potential costs of renting these temporary venues.
3.2 Equipment and other costs
When you are preparing a mapping project budget, be sure to consider a number of other potential costs, including the equipment, supply, and service expenses described below. See box 3.1 for an estimate of the hardware needed to serve a 10-person project team.
The following hardware will serve a project team of at least 10 people, depending on mapping methodology:
- 5 laptops (assumes one mapping team per laptop)
- 2 GPS devices (assumes you will use GPS, but not all the time)
- 1 printer (for printing Field Papers and survey forms) along with necessary ink and paper
- 1 projector (for presenting the project to partners and for trainings)
3.2.1 Hardware Needs
Computers: Data entry and analysis for OSM generally requires desktop or laptop computers. Laptops, being portable, can also be used to facilitate training sessions or mapping parties at venues away from the team’s office. Typically, one computer for every two members of your mapping team will suffice for most needs.
Projector: A projector is required for sensitization and awareness-raising presentations and in mapping workshops where the venue does not provide a projector. It will also be used when these presentations are offered at the office.
Handheld GPS devices: GPS units will record the “track” of the mappers (where they went while collecting data) and can record points of interest (POIs).
Mobile Android mapping devices: Instead of GPS units, you may opt to use Mobile Android devices. A variety of smartphone applications provide specific OSM mapping functionality. Currently, Android applications such as OSMTracker are the best. Mobile devices such as these usually have GPS chips inside them, allowing them to behave like a GPS device, but with additional functionality.
3.2.2 Printing Needs
Printer: A printer will be needed to print the Field Papers. If you are using paper survey forms to collect attributes for many features such as buildings, you may be making thousands of photocopies. This process takes time and money, and it should be considered while planning logistics. For example, a pilot project in Sri Lanka faced the challenge of photocopying over 30,000 data entry forms during the course of the project.
Business cards and brochures: These materials are useful when establishing credibility in the field. Community members can be suspicious of mappers collecting data, and it is necessary to ease their concerns. A printed brochure will outline the project methodology and goals. Cards and brochures can easily be distributed while collecting data in the field—raising awareness of the project in the community and boosting credibility when fielding questions. Business cards and brochures should be distributed at all presentations and meetings.
Event signage and promotional materials: Other printed materials include banners and posters for larger events such as mapping workshops.
3.2.3 Mapping Workshop Expenses
Rent: Community mapping workshops should be held in a variety of locations. Where possible, a host should be identified to provide the venue. If this is not feasible, a venue should be rented.
Food: Although workshops will vary in length, they should typically be half- or full-day events. Therefore, provide a meal such as lunch for the mappers along with coffee and snacks. For community mapping parties, it is customary to supply a cake that depicts a map of the local area on the top.
Internet connectivity and electricity: Internet connectivity should always be considered and, where possible, redundant systems established as an option in case connectivity fails. Likewise, rechargeable batteries should be available for the projector and any GPS devices.
3.2. 4 Surveying Expenses
Surveying and office supplies: The mappers will need clipboards, pens, and pencils to complete surveying tasks.
Transportation expenses: When specific sites have been identified to map, transportation may be required to take mappers into the field and return them to the venue, where data can be entered to OSM.
3.3 Training
Once you have established your management structure and hired staff, you will need to train them. On a practical level, they will need to know how to map with OpenStreetMap, how to use the JOSM or iD editing software, and how to create and use Field Papers as well as any specialized information about the data they will be collecting. For example, if they are collecting data on buildings’ structural attributes, they will need to learn some engineering basics. We can separate the training components into two broad areas: those concerning OpenStreetMap tools and software and those concerning surveying techniques and understanding the data model.
Take the time and care to train the staff thoroughly. Remember that you are essentially training your future trainers, because good managers and mappers will be able to teach others about mapping and offer trainings with partner organizations and with volunteers. If it fits within your management structure, it is a good idea to a have a core team of managers who are more extensively trained than the mappers whom they oversee. The core team should become experts in OpenStreetMap and surveying techniques, so they will be equipped to manage and provide answers to other mappers. In Open Cities Dhaka, for example, a core team was trained over the course of a week and went to the field each day to practice surveying and then editing in the office. Although they were not experts after a week, they were able to lead a two-day training for a larger group of mappers and answer most of their questions.
3.3.1 Training on Mapping Tools
Basic OpenStreetMap training can take as few as two days. This is a typical amount of time to work through the beginner training material available on learnosm.org. However, learning OSM in depth requires time and plenty of practice. Training should include both classroom time to work through the software step by step and multiple field excursions.
While training core staff, it is a good idea to dedicate at least one week and sometimes two simply to mapping and training. That way, the staff will have plenty of supervised practice before they supervise others. This training period can also overlap with project preparation. Even after training is complete and mappers are doing their job, take care to watch for mistakes and help the mappers continue to learn.
A typical OSM training outline includes the following:
- 1. Introduction to OpenStreetMap and signing up for an account
- 2. Using OSM’s online editor, iD
- 3. Using the offline editing software, JOSM
- 4. Understanding OSM concepts such as nodes, ways, and tags
- 5. Mapping in the field
- 6. Using aerial imagery to edit
- 7. Using a GPS device to map
- 8. Creating and using Field Papers to map
These are the main areas to cover when training beginners, but the list can easily be either expanded or shortened, depending on the training needs. For specific training materials, visit learnosm.org and MapGive’s short tutorials on mapgive.state.gov.
3.3.2 Training on Surveying
The second training component concerns your project’s specific data model and how to collect accurate attributes in the field. For example, in the pilot project in Dhaka, structural attributes about individual buildings were collected, such as the type of structure and whether the building had vertical irregularity. Because not all of the surveyors were not engineers, this training required several days, including practice identifying buildings in the field.
The amount of training time that should be dedicated to this component depends on the complexity of your data model and the background of the mappers. For example, not much instruction is required to collect only street names and surface types. But if you are collecting detailed structural attributes of buildings, mappers will likely need to learn some engineering basics in order to identify various attributes. They will also need precise definitions of those attributes. For example, if one of the attributes you are collecting is the building’s condition, and the possible values are “poor,” “average,” and “fair,” you will need a precise description of each of these subjective terms.
It is a good idea to develop a survey training manual for mappers that includes clear descriptions of the various attributes you are collecting along with photographs. In the Open Cities Dhaka project, for example, the survey required detailed engineering knowledge. The team’s training manual clearly showed the differences between types of masonry, for example. It was also particularly valuable to differentiate subjective attributes, such whether a building’s physical condition was “poor,” “average,” or “good.” Mappers had clear definitions for each so they could accurately and uniformly identify those values in the field.
All said, a week of training is probably more than adequate for most projects, and this can be combined with actual mapping activities that managers lead or supervise. The more experience mappers have, the better they will do, but they will need ongoing guidance as they learn how to map properly.
During the project set-up phase, the following tasks should be completed:
Logistics
- Identify where your staff will work
- Ensure reliable Internet connectivity
- List the equipment you need and acquire it
Training
- Identify who will conduct the training and what material will be covered
- Collect necessary training materials, develop training manual
- Identify a location to host the training (maybe the same as the project office)
- Create a training schedule
Implementation and supervision
Now that we’ve discussed the planning stage and project logistics, we will consider the activities that go on during a mapping project. We will discuss the methodology for data collection (known as the data capture strategy), project scheduling and daily workflow, quality control, and reporting.
4.1 Collection the data
A principal consideration in a mapping project is the data capture strategy. How will your mappers go out each day, collect information, come back to the office, and enter it into the OpenStreetMap database? And how will they do this efficiently and accurately?
Unfortunately, there is no single recipe for a perfect data capture strategy. There are too many variables: the area being mapped, the data model, the available resources, and so on. Still, we can suggest some methods that have been successful in the past.
We will assume here that the surveyors are using Field Papers and any additional survey forms required for mapping. We assume this because, as noted in the chapter on project design, Field Papers can be created even when imagery is not available. For now, we will ignore the non-paper-based methodologies, such as the use of GPS and mobile devices. Of course, you are free to include them in your process as you design it.
4.1.1 Creating Reference Maps
Each day, mapping teams will venture into the field carrying clipboards, pens, and papers. Before fieldwork begins, some preparation must be done. Mappers need to know where they are going, how to orient themselves once they get there, and how to use existing features on the map to correctly position new ones.
For orientation purposes, you could supply mapping teams with aerial imagery printed in color. This can be a little costly to produce, but especially in dense areas, the imagery can be a great help in locating places on the ground. Alternatively, printed maps will also help teams to orient themselves, particularly if the existing data include street names and significant landmarks.
Once the mappers are oriented in the field—understanding where they are and able to match their locations to positions on their printed imagery and base map—they are ready to start collecting new features. Typically this is done with a combination of Field Papers and survey forms. (As section 2.4 discussed earlier, Field Papers are printed OSM maps that the surveyors can sketch on to draw new features on the map.)
4.1.1.1 Tracing Imagery
Tracing lines and polygons on top of imagery is a great way to produce base data before going into the field. Because it is usually easy to identify roads on top of imagery, the tracing will make the roads available on your printed base map.
Imagine you are collecting attributes about buildings. By having your mappers draw the buildings before they go into the field, they can print out Field Papers that already have all of the building polygons on it. They can then easily collect attributes by enumerating each building on the Field Paper and filling out a survey form marked with the same number.
4.1.1.2 Producing Reference Maps and Field Papers
In any project, someone should be responsible for producing reference maps and Field Papers. Managers might either perform this task or delegate it to each mapping team individually. If possible, it is advisable for managers to do it, because they will be keeping track of the areas that each team maps and can ensure that teams are always equipped with the appropriate papers. Creating and printing Field Papers can take some time each day, so that time should be considered while scheduling activities.
4.1.2 Defining Daily Mapping Areas
Each day, you will send mapping teams to different parts of the target area. Thus, one of the first tasks will be to determine what those smaller units of the area look like. For example, let’s assume that each pair of mappers will go out for field surveys for four hours each day. This means that you will want to provide them with the resources (Field Papers, survey forms, and reference maps) to cover an area that you estimate will take about four hours to survey. You also might want to give them papers for an adjacent area of similar size, which they can start working on if the first area takes less than four hours.
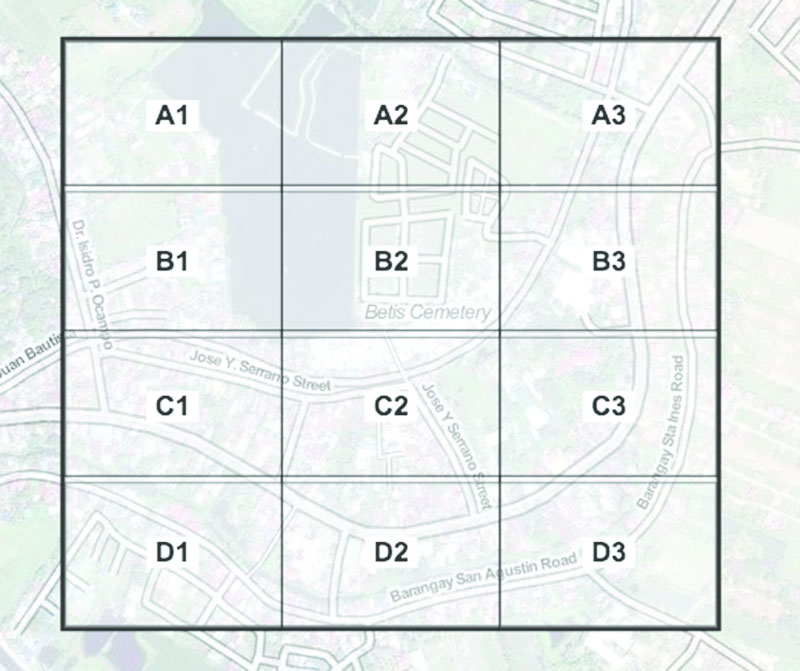
As figure 4.1 shows, you can subdivide your target area in two ways: by creating a grid or by defining areas with natural boundaries. In terms of preparation time, is easier to use a grid system because you can simply print out a large grid of Field Papers, and assign one paper to each mapping team each day. On the other hand, from a surveying perspective, it makes much more sense to follow existing boundaries such as roads and map everything within a given block. Organizing areas this way may require more preparation but will be more efficient in the long run.
Figure 4.1 Options for Subdividing a Daily Mapping Area a. Gridding an area
It is a good idea to divide the target area early in the project. If possible, do this before fieldwork begins, though you will need to have existing road data. Otherwise, you might set aside some time in the first few days for survey teams to simply map all of the roads, which will then make it easier to divide the total area into daily mapping areas.
Once you do this, you will know how many of these “blocks” are in your target area, and you can estimate exactly the time and staff you will need to survey it all. Let’s say, for example, that you have a target area that you then subdivide into 20 blocks, a partial example of which is shown in figure 4.2. You then estimate that each block will take about four hours to survey and a couple of hours to edit, which means it will take one pair of mappers to map one block every day. If you have one mapping team, it will take 20 workdays to map the entire target area; if you have two mapping teams, it will take 10 workdays, and so on.
Figure 4.2 Example of a “Blocked” Target Area in Dhaka, Bangladesh
How would you manage this workflow? Each morning, you would give each team a block to map. You print out Field Papers that cover the areas they are supposed to map and draw a boundary around the specific area or explain it to them directly. Give them additional forms (survey forms, if you are using them) and the same materials for an adjacent square where they can map if they have extra time. (For this reason, as box 4.1 explains, teams should receive block assignments that are not adjacent to each other on any given day.)
In the afternoon, the teams will return to the office and begin editing. The manager will be there to answer questions about surveying and editing and to ensure that everything gets uploaded to OSM without problems. The next day, the process will repeat, thus ensuring that the target area is mapped in the expected time.
It is recommended that adjacent blocks are not given to different teams to map on the same day. To do so would increase the likelihood of editing conflicts, which occur when two teams try to edit the same features at the same time. The assignment of nonadjacent blocks to each team also allows your mappers to continue mapping if their block takes less time than they expect. For these reasons, it is better to organize daily mapping activities following a checkerboard pattern, as shown in figure B4.1.1.
Figure B4.1.1 Sample Mapping of Nonadjacent Squares in Guagua, Pampanga, Philippines4.1.3 Collecting Field Data
Let’s take a closer look at the first half of the mapping job: field data collection, or field surveys. We will assume that the workday is split in two, the first half for field surveys and the second half for editing. This schedule, of course, may differ based on the needs of the project.
Each mapping team will need to have the necessary mapping materials each day as well as direction about where to map. Exactly which materials each mapping team has will vary based on the resources available and methodology of the project. At a minimum, each mapping team will need the following supplies:
- Field Paper of the day’s area
- Survey forms (if necessary) for collecting attributes
- Clipboard to keep papers and write on
- Pen
- (Optional) Printed map showing satellite imagery in color for orientation
With this survey methodology, the idea is to draw features on the Field Paper and mark them with identifying numbers. Then, on a separate sheet of paper, the mappers can write down the attributes of each feature. In the case of detailed surveys, such as a building survey, you may include a form that the mappers can fill out for each building to ensure that they collect all attributes in an orderly fashion.
4.1.4 Developing Survey Forms
Mapping teams should receive sufficient survey forms each day. A good survey form should be organized, simple, and clear. As shown in figure 4.3, the form should be filled in with the surveyor’s name, the date, an identification (ID) number for the part of the target area they are mapping, an ID number for the Field Paper corresponding to the form, and an ID number for the specific feature being mapped.
The remainder of the form should reflect all of the attributes being collected as part of your data model (discussed earlier in section 2.2.3). In other words, for every attribute in the data model, the survey form should have a field to fill in. For attributes that can only have values within a certain range (for example, from “poor” to “good”), it is a good idea to have checkboxes or multiple-choice options on the form.Survey forms should be covered extensively in the second part of your project training, which covers the identification of features. Mappers will need practice to identify all the different attributes covered in the data model and to understand how to properly fill out the survey forms.
4.1.5 Entering the Data (Editing)
The second component of mapping work is data entry. In a typical scenario, teams will go out mapping in the morning, return to an office space, and edit in the afternoon. This is usually a smooth process, though if you don’t have the space or equipment for every mapping team to sit and edit their work at once, you may need to come up with creative solutions, such as having half of the teams map in the afternoon and edit in the morning.
It is best to do data entry on the same day as the data collection, or the following day at the latest. Although mappers will be sketching out the features they collect and filling in data forms during data collection, they often remember a lot of information simply from having observed an area, and that information is best preserved if they edit the map soon after surveying. (See box 4.2 regarding custom presets, which can assist the mappers in adding features to their maps.) For the same reason, it is best for mappers to be involved in the editing process rather than splitting up the jobs of editor and mapper, though this division has been done with some success in the past.
Conducting data entry directly after collection and ensuring that the mappers take part in the process will help maintain an efficient and accurate flow of information from the fieldwork into the OSM database. Be sure to keep the mapping forms and Field Papers well organized and filed, however, in case you need to return to them later when you review the data.
During editing, your mappers will most likely be using either the offline JOSM software or the online iD editor. Because you will probably use a custom data model, you will want to add a customized menu to the editing software for adding the specific features that your mappers are collecting. This is done by creating a custom presets file, which implements a menu that makes it easy to attach the correct OSM tags to features.
You can read more about creating custom presets here at http://learnosm.org/en/editing/creating-presets/. HOT has created an easy-to-use visual editor for creating presets files, available at http://visualtags.hotosm.org/
Figure 4.3 Sample Building Survey Form
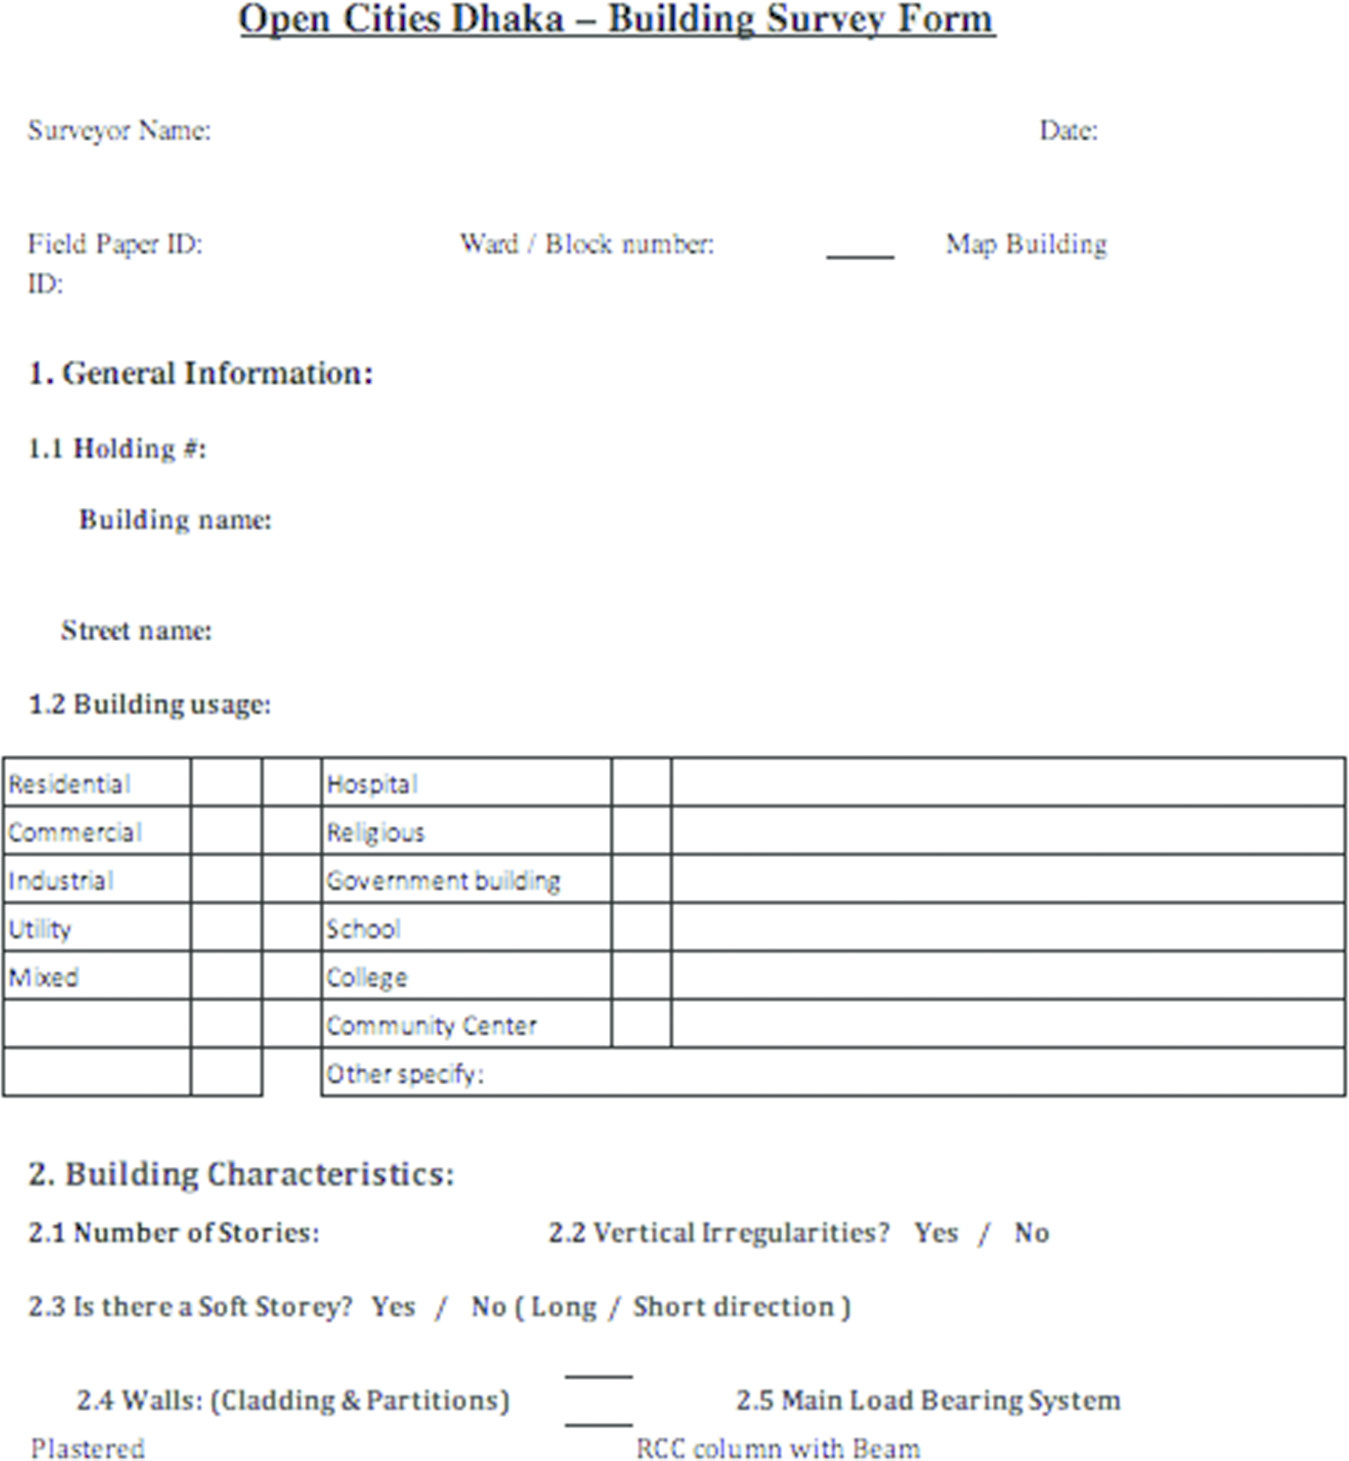
4.1.6 Scheduling Project Tasks
The implementation phase will benefit from a clear project schedule. During project design, you should create a sample project timeline (as previously shown in section 2.2.5). As the components of the project become more well-defined, schedules should include more detail.
Of all of the tasks that go into a mapping project, several of the seemingly simple ones can be the most troublesome. For example, if you plan to import data, this becomes a critically important task because survey work cannot commence until this is completed. If you schedule two weeks for data importing and it then takes four, it will delay other tasks and thus the whole project. Similarly critical tasks include finalizing the data model and setting up alternative imagery sources, if applicable. Address these tasks right from the start and allow ample time to complete them.
Managers must also make clear schedules for themselves and other mappers during the implementation phase. This is when the project will greatly benefit from the care taken in the project design phase to clearly define the target area and the data model. Managers should divide the project area into daily mapping blocks, enumerate them, and assign them each day to mapping teams. The size of the blocks may change: during the first weeks of a pilot project, it will become clearer how much area a single team can reasonably cover in a single day. Once this is understood, it will be easy to calculate how many teams and how many days will be required to complete the mapping activities.
Scheduling mapping activities is important for completing the daily work, but care should also be taken to schedule appropriate time for preparing papers and logistics for mappers. For example, if a manager is overseeing four mapping teams, a typical day might look like this:
- 8–9 a.m. Assign each mapping team to an unclaimed block in the target area. Create and print Field Papers for each team. Get survey forms and put all paperwork into the mapping teams’ binders or clipboards.
- 9 a.m. Meet the mapping teams. Explain to each team where their area is and how to get there. Hand out paperwork and send teams to the field.
- 9 a.m.–noon Accompany one of the mapping teams to the field to assist them and assess their work.
- Noon–1 p.m. Lunch
- 1–4 p.m. Meet mapping teams back at the office and set them up at computers for editing. Help the teams with any questions they have about the editing process. Especially early in a project, review each team’s edits before they upload them to OpenStreetMap. Make a list of common mistakes and explain them to everybody using a projector.
- 4–5 p.m. Organize the paperwork from the day and begin preparing for the next day. File the completed survey forms and Field Papers for later reference. Mark the completed areas on the project map. Meet with other managers to discuss any outstanding issues.
4.2 Common challenges
There are a few common threats that many mapping projects endure. It’s best to identify these potential threats early and develop backup plans in case something goes wrong.
4.2.1 Bottlenecks
Among the great threats to a mapping project are unexpected bottlenecks that result in the loss of much time and work. For example, if you are importing data from a government agency, but you can’t begin mapping until the data have been imported, make sure that you allot enough time in advance to acquire the data, obtain permission to use it, and import it.
If there is a weeklong religious holiday a month into your project and nobody will be working, you should identify that from the beginning. If the Internet connection tends to go off every second day, you may need to find another way of connecting your staff. Other common bottlenecks are the availability of hardware (such as having enough computers for your mapping teams) or the ability to print enough Field Papers and survey forms to keep up with the mappers’ needs.
4.2.2 Time Management
A great deal of time is lost in places where you would not expect. This adds up and can significantly slow down a project. One common loss of time is during morning meetings. Out of 10 people, 1 or 2 are always late. Don’t let their tardiness stop the rest of the group from working, and try to enforce a policy of punctuality. Time is also lost in the logistics—for example, printing Field Papers, preparing computers, and using the Internet. Keep these processes running smoothly to save time and energy.
In addition, transportation can drain staff time unexpectedly. Be sure to build transportation time into the staff schedules. You can’t expect a team to map for a full four hours if they need an hour to get to and from their mapping area. Consider faster ways for them to get there. For example, mapping teams may be allowed to take survey equipment home with them and then head directly to the survey sites in the morning. This option, of course, requires trust that they will begin working on time.
4.2.3 Survey Fatigue
Mappers who survey every day may tire of it over time. It is physically demanding work and can sometimes feel monotonous. Generally mappers do better work if they maintain their enthusiasm. Finding ways to keep them motivated can aid a great deal—for example, by varying the work on occasion, providing frequent trainings to learn new things, and offering incentives for good work.
4.3 Quality Control
One of the manager’s primary jobs is to ensure quality control of the data being collected and entered into OpenStreetMap. Quality control involves three principal tasks:
- Daily data checks
- Resurveying
- Data analysis
4.3.1 Daily Data Checks
The most immediate way to ensure quality is by staying in close contact with the mapping teams, keeping track of their edits, and discussing questions and concerns with mappers when they arise.
New edits and additions should be reviewed and validated daily or at most weekly. This is an important supervisory task because catching mistakes and bad editing practices early means that they can be corrected and the editors can learn to do things properly. Managers should be highly proficient in the JOSM software, using the validation and search tools to examine project data. (Box 4.3 discusses some of these tools.) Key aspects to review are
- Topology errors (such as overlapping buildings or incorrect relations);
- Tagging errors (misspelled tags or misused key-value combinations); and
- Completeness of data (whether all attributes in the data model have been collected).
Managers should always be available during editing hours to answer questions and to check for mistakes. Each day they should review their mappers’ work and discuss any errors with them. They should also review common mistakes using the projector so that everybody may learn and benefit.
Many tools can help OSM users check for errors in the data. The JOSM validation tool allows you to run an analysis and check for errors before uploading changes. An online tool called KeepRight (keepright.at) provides similar analysis and can help you find and correct mistakes. For a complete, up-to-date list of OSM quality assurance tools, visit wiki.openstreetmap.org/wiki/Quality_assurance
4.3.2 Resurveying
Another method of quality control is to conduct secondary surveys at regular intervals. One day every week or two, 5–10 percent of the completed work should be resurveyed. Survey teams can resurvey each other’s work, or, if possible, their more-experienced managers can undertake the reviews.
The areas selected for resurveying should be randomly selected from different areas, although at least one sample area should be taken from every mapping team throughout the course of the project. The resurveying process involves collecting the same data twice, comparing those sets of data, and looking for mistakes. For example, if you are mapping buildings and 1,000 buildings have been mapped, a resurvey would cover 50 to 100 of those buildings again. Based on the percentage of error you find, you can extrapolate the likely percentage of error in the entire survey.
Quantum GIS. Such software allows for advanced querying and analysis of the data in order to answer question such as these:
- What features are missing attribute tags?
- Where do the values look out of the ordinary?
- Where are names misspelled?
More detailed information on quality control and data analysis can be found in HOT’s “Reviewing OSM Data3” document. For more about quality reviews conducted after project completion, refer to the “Scientific communities” entry in table 2.1 on partnership sources.
Resurveying has three main functions:
- It gives your mapping teams the opportunity to check and correct mistakes in their work.
- It allows managers to find recurring errors that mapping teams make and discuss them with the teams to improve their work in the future.
- It provides an important metric for project reporting: the percentage of error. A margin of error of 5 percent or less will probably be acceptable, although, of course, you should strive for the greatest accuracy possible.
4.3.3 Data Analysis
Just as resurveying helps to improve the data collection process, analyzing the data in JOSM improves the editing process. Another way to analyze the data is through GIS analysis, which may benefit both data collection and editing.
It’s a good idea to regularly (once or twice a month) review the project data in GIS software such as
4.4 Reporting
Most mapping projects have a financial backer and partners who will be interested in project reports. Depending on the length of the project, the reports may be issued at various intervals, and they will most certainly include a final project report.
How often should reports be submitted? Of course, this will depend on the donors’ requirements, but for projects of six months or less, a good rule of thumb is to deliver a midterm report and a final report, as well as brief snapshots of mapping progress every two to four weeks.
For longer projects, you may want to deliver midterm reports quarterly.
The midterm and final reports should include extensive evaluation of the project to date. They should summarize the project activities and outcomes, including partnerships, mapping activities, and the data collection progress. Lessons learned and changes to the original project design should also be detailed. In addition, these reports are the appropriate place to document the results of your quality control processes, particularly the estimated level of data accuracy and your error-checking methodology.
The more–frequent interim “snapshots” need not be as detailed. The purpose of these regular updates is to report on mapping progress and maintain metrics on the pace of data collection. For example, if the project primarily involves building data collection, you will want to report the number of buildings mapped each week, the anticipated time to completion, the rate of mapping per day, and so forth. This will help to assess how your data collection process evolves over time.
GIS queries can help you to provide good metrics. These queries can answer questions such as these:
- What percentage of the target area has been mapped?
- How many buildings have been mapped?
- What is the average number of buildings a mapping team completes each day?
- What is the estimated time to completion?
For a sample project report, see Appendix 6.1.
During the project implementation phase, the following tasks should be completed:
Collecting the Data
- Create and print reference maps
- Divide target area into daily mapping blocks; enumerate and make a statistics spreadsheet, providing each block its own row
- Create and print survey forms
- Create and print survey training manual
- Make daily work schedule
- Create detailed project implementation schedule
Quality Control
- Determine methods to monitor data quality, and include these in both your project schedule and daily schedule
Reporting
- Determine the metrics to include in project reports
- Add tasks to the schedule to ensure that metrics are collected and documented regularly
- Maintain statistics each day in a spreadsheet
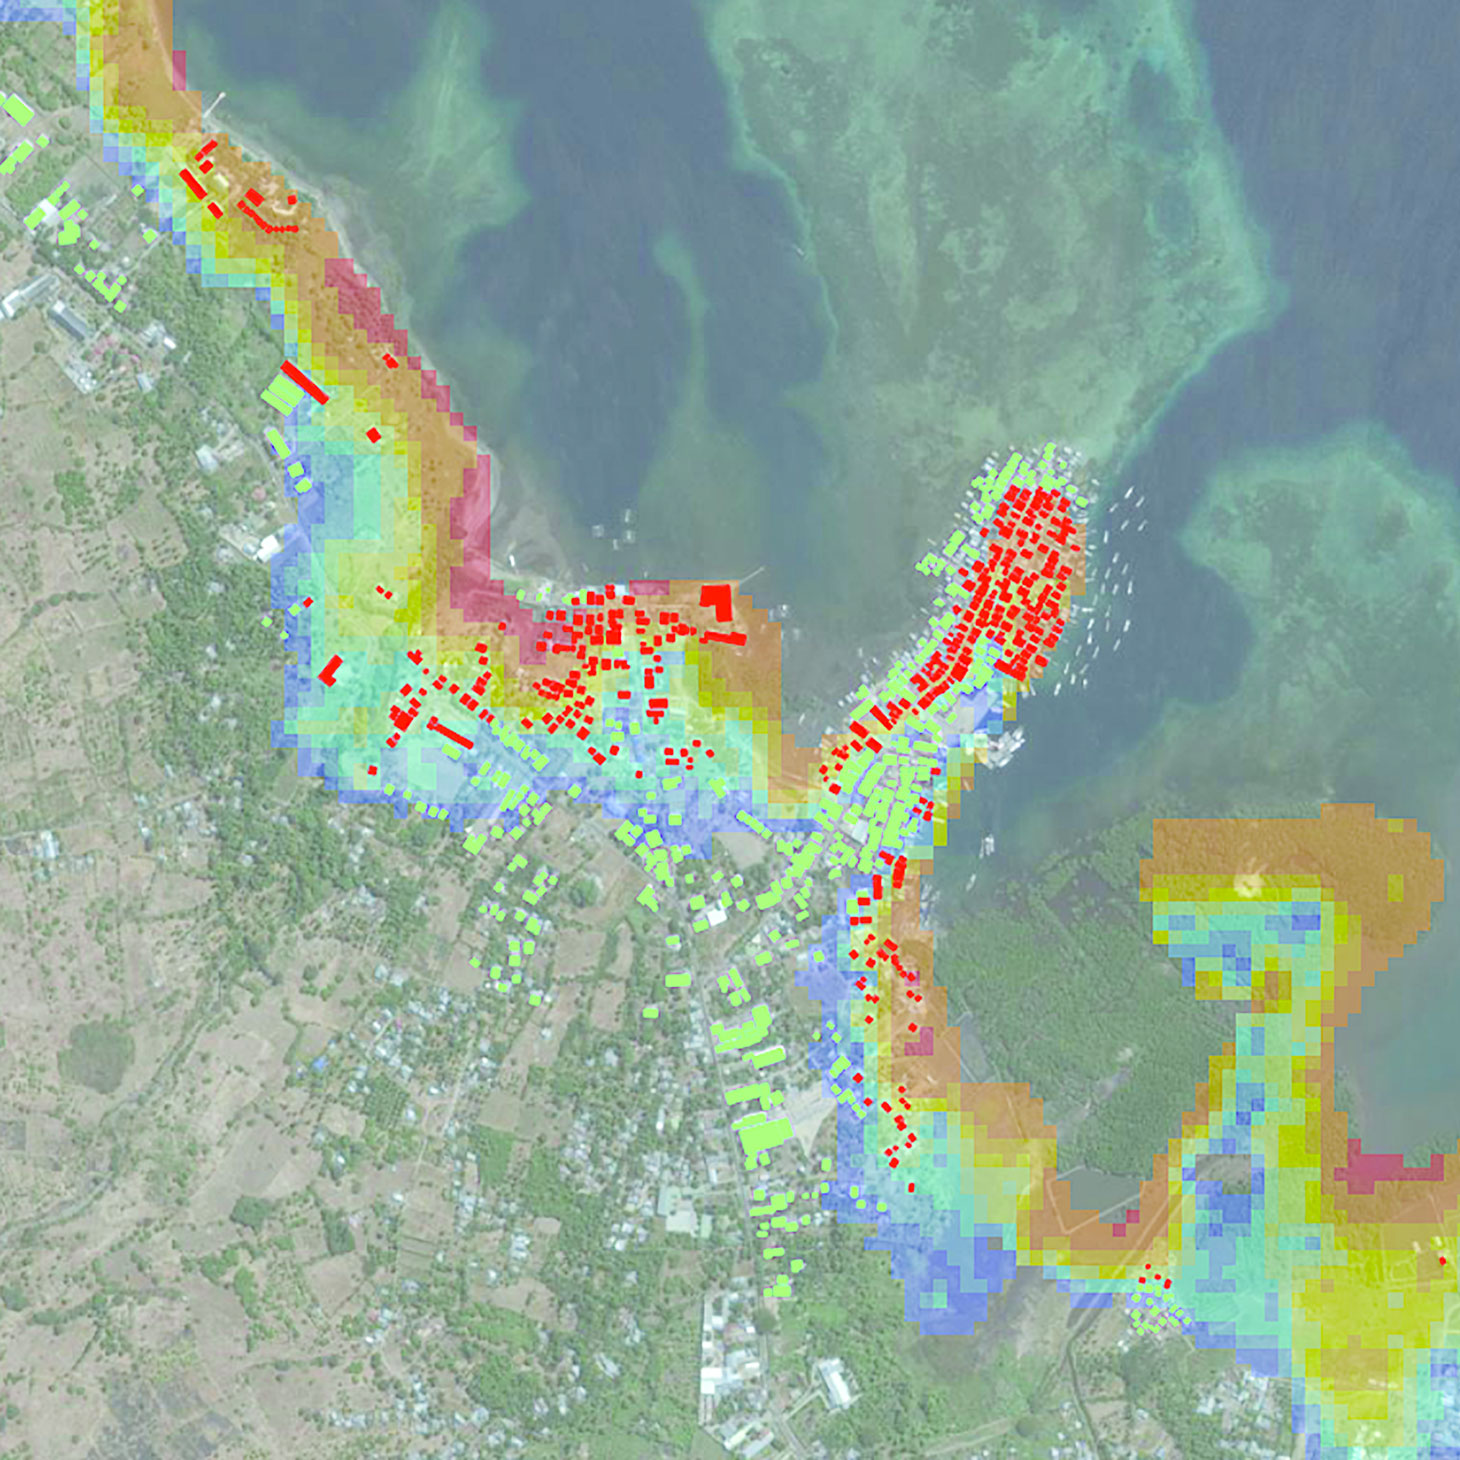
Lessons learned and recommendations
The preceding sections took a practical look at how to plan and implement a mapping project. Open Cities is ongoing, and improved methodologies and knowledge come out of each successive project. In this chapter, we conclude by highlighting several key lessons learned from the first year of the design and implementation of previous Open Cities initiatives.
5.1 Government ownership
Although many partners and participants in an Open Cities project will be from civil society and the private sector, it is critical that government counterparts be involved in a project’s development and execution. Governments are primary stakeholders for many disaster risk management and urban planning projects, and they provide necessary legitimacy to Open Cities work.
In Kathmandu, the involvement of the Department of Education helped to build their confidence in using the data to prioritize seismic retrofitting activities. The mapping team carried an official letter in support of the project, which was also critical to their ability to gain access to schools and health facilities to conduct surveys. In Sri Lanka, local government authorities were directly involved in the mapping activities to ensure government ownership and use of the data. Key national agencies were regularly briefed and consulted.
Involving government in this way also makes it easier to adopt a systematic approach to mapping, and it makes it easier to obtain existing data sources for mappers in areas that may not have many other partners to engage. Engaging governments early in the planning process and ensuring close involvement throughout is an essential component of a successful Open Cities project.
5.2 Partnerships with universities
Universities have been valuable allies during the first year of Open Cities work. Outreach to university departments in engineering, geography, computer science, and planning provided critical connections and support to Open Cities projects. Students from universities’ technical departments frequently have the proper technical backgrounds to quickly learn OpenStreetMap. In both Dhaka and Kathmandu, university students have played important roles in mapping activities and software development. Some universities also require students to complete internships or volunteer projects before graduation, which led a number of students in Kathmandu to participate in Open Cities.
University faculty members have also provided useful support. In Dhaka, professors from the civil engineering and planning departments at Bangladesh University of Engineering and Technology (BUET) provided necessary input into the design of the mapping project. Professors in Kathmandu University’s geomatics department have provided guidance to the project on quality control techniques for surveying and have incorporated OpenStreetMap into their courses. Training future classes of university students will help the OSM community in Kathmandu continue to grow after the formal project period has ended.
5.3 Access to imagery
As shown in the OpenStreetMap community’s post-earthquake work in Haiti, access to high-resolution satellite imagery is extremely useful for efficient mapping of infrastructure. However, such imagery is often prohibitively expensive or only available under licenses that would prevent digitization by the public.
With this in mind, the U.S. Department of State’s Humanitarian Information Unit (HIU) launched an initiative in 2012 called “Imagery to the Crowd.” This program makes high-resolution imagery— purchased by the U.S. government from providers such as Digital Globe—accessible to humanitarian organizations and the volunteer communities that support them. Open Cities Kathmandu partnered with USAID and Imagery to the Crowd to release 2012 satellite photography for the Kathmandu Valley and to organize volunteers in Germany, Nepal, the United Kingdom, and the United States to digitize building footprints. The data created by these volunteers have been incorporated into USAID disaster response planning, providing a solid foundation of data upon which the Nepali OSM community can continue to expand and improve.
5.4 Community connections
OpenStreetMap and many of the other tools discussed in this toolkit have global networks of users, software developers, and knowledgeable experts who interact and share best practices through e-mail lists, in-person conferences and meetups, and other forums. Connecting participants in Open Cities projects to these communities can be a rewarding experience for them and provide valuable access to a global knowledge base.
As part of the Open Cities Kathmandu project, the local team helped to organize a number of events commemorating International Open Data Day in February 2013. The day’s activities included a “mapathon” in which teams worked together to digitize building footprints in the Kathmandu Valley. Local groups were connected to international volunteers, and, together, all participants mapped over 8,000 buildings in a single day. The local team also established important relationships with experienced OSM contributors who have provided significant support to the growing community in Kathmandu. In addition, the Kathmandu community helped digitize information into OSM after the Typhoon Yolanda hit the Philippines in November 2013. These relationships are an important factor in OSM’s global success, and project designers should seek opportunities to support them through Open Cities work.
5.5 Building trust in the data
Data quality is a frequently raised issue in community and volunteer mapping projects. The Open Cities Project has taken numerous measures to ensure that partners and intended users of the data would trust its accuracy and completeness. In Kathmandu, partner organizations including the National Society for Earthquake Technology (a respected NGO working on seismic resilience) and the Kathmandu University Geomatics Department provided technical guidance to the project as well as independent quality assessments throughout the process. In Dhaka, key stakeholders including BUET and representatives of government and civil society were consulted throughout the project, and many of them received basic trainings in OpenStreetMap to familiarize them with the platform.
5.6 Sustained engagement
Finally, it is important to note that, for these projects to be successful, sustained engagement with local partners is necessary. Too often, technology and data projects of this sort are discrete, short-term endeavors. A workshop or a weeklong training course is simply not enough time to effect the kinds of shifts that Open Cities hopes to support.
Although OpenStreetMap makes mapping more accessible to nonspecialists, it doesn’t change the fact that collecting and using geographic information is a complex technical undertaking that requires more training and involves a longer learning process than many people assume. Building technical communities of OSM mappers and software developers who are familiar enough with the platform to comfortably deploy it in their own tools and applications also takes time, but such community building is integral to the sustainability of Open Cities projects.
Finally, Open Cities seeks to contribute to cultural and policy shifts within technical groups and government bodies that prioritize open data and broad participation in development challenges. When planning these kinds of projects, it is important that the parties involved understand and commit to sustained investment in their success.