Detailed Examples of SQL2GEE’s use
We present a few detailed use cases of SQL2GEE.
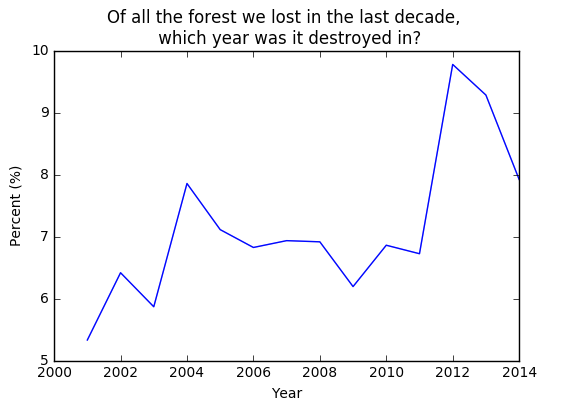
Finding forest-loss statistics between 2001 - 2015
The Hansen et al Global Forest Change data-set shows high-resolution statistics on forest cover and loss during the past decade. These data are available via Google’s Earth Engine platform, via the data-set ID UMD/hansen/global_forest_change_2014.
These data have a band called lossyear, which shows, for every pixel where forest was lost, the year that the loss likely occured. The integers are from 0 to 14, all values > 0 indicate year since 2000. Pixels with a 0 value indicate locations where forest was not lost (and should be ignored).
Let’s use the ST_HISTOGRAM function of the SQL2GEE library to create a step-plot (using Matplotlib), to show these data.
First, we load the required libraries, and authenticate with Earth Engine.
1 2 3 4 | from sql2gee import SQL2GEE
import ee
import matplotlib.pyplot as plt
ee.Initialize()
|
Next, we make a request via SQL2GEE to the Hansen dataset. Calling the response property we can confirm that a histogram has been successfully returned.
1 2 3 4 5 6 7 8 9 10 11 12 13 14 15 16 17 18 | sql = 'SELECT ST_HISTOGRAM(raster, lossyear, 15, true) FROM "UMD/hansen/global_forest_change_2015"'
q = SQL2GEE(sql)
q.response
{'lossyear': [[0.0, 1291270.0],
[1.0, 192.0],
[2.0, 483.0],
[3.0, 449.0],
[4.0, 1185.0],
[5.0, 462.0],
[6.0, 1264.0],
[7.0, 2156.0],
[8.0, 514.0],
[9.0, 343.0],
[10.0, 1374.0],
[11.0, 334.0],
[12.0, 992.0],
[13.0, 2624.0],
[14.0, 7629.0]]}
|
We can extract these data and plot them as follows:
1 2 3 4 5 6 7 8 9 10 11 12 13 14 15 16 17 | bin_pos = []
counts = []
for pair in response['lossyear']:
bin_left, count = pair
bin_pos.append(bin_left)
counts.append(count)
bin_pos = np.array(bin_pos)
counts = np.array(counts)
percent_value = (counts[1:]/sum(counts[1:])*100.)
year = bin_pos[1:]+2000
plt.plot(year, percent_value)
plt.title('Of all forest lost in the last decade, \n which year was it lost in?')
plt.xlabel('Year')
plt.ylabel("Percent (%)")
plt.show()
|