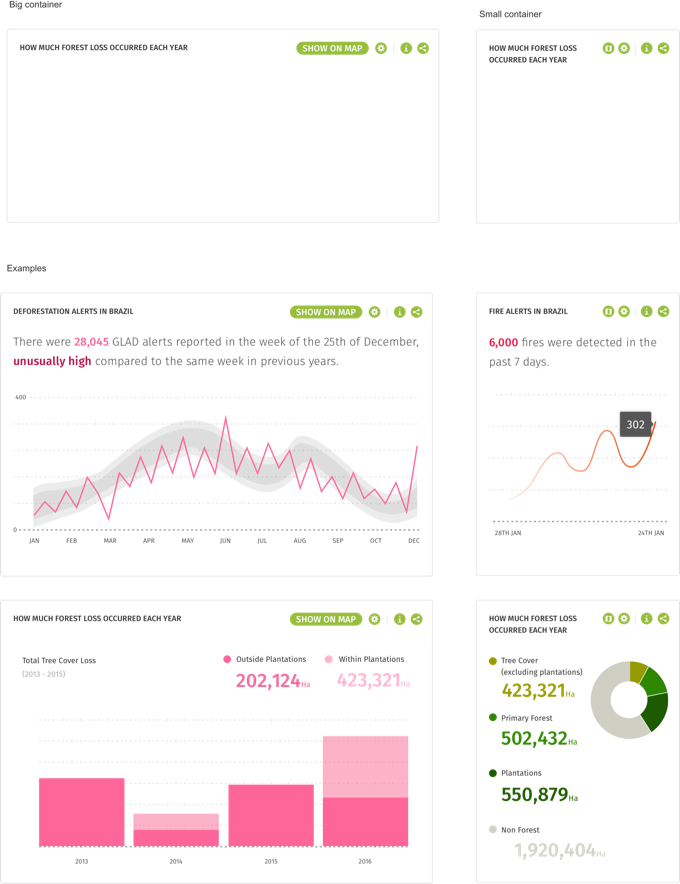
Use charts to display data visually. Please use the main GFW colors and style (simplicity, clarity, cleanliness) to design new graphs and charts. When using charts, please include a clear legend and summary sentence that highlights the main points the chart tries to convey.
Please request access to the UI Kit Invision project for a full inspection of all these elements. Preview UI Kit
Examples
These are some of charts. They include line, bar and pie charts.
